The post Solana Compressing in a Narrow Range—Is SOL Price Gearing Up for a Massive Move? appeared first on Coinpedia Fintech News Over the past few days, the SolanaThe post Solana Compressing in a Narrow Range—Is SOL Price Gearing Up for a Massive Move? appeared first on Coinpedia Fintech News Over the past few days, the Solana

Solana Compressing in a Narrow Range—Is SOL Price Gearing Up for a Massive Move?

2026/04/01 01:09
3 min read
For feedback or concerns regarding this content, please contact us at crypto.news@mexc.com
Solana Price Could Slide to $50 if $75 Support Breaks—Here’s the Bullish and Bearish Scenario

The post Solana Compressing in a Narrow Range—Is SOL Price Gearing Up for a Massive Move? appeared first on Coinpedia Fintech News

Over the past few days, the Solana price has been trading range-bound, strongly defending the $80 support while failing to reach $95. This has prevented the token from securing the $100 range, which could have attracted significant buying pressure. In times when the broader crypto market remains uncertain and Bitcoin shows signs of structural pressure, SOL price behaviour also displays weakness as traders remain indecisive. 

This raises a key question: is SOL price quietly accumulating strength for the next rally, or is this range forming as part of a distribution phase before the next price action?

Solana TVL Decline Signals Weak Underlying Demand

Solana’s Total Value Locked (TVL) has been trending downward over the past several months, reflecting a steady decline in on-chain liquidity and user participation. Data show TVL falling from above $12 billion in late 2025 to nearly $6 billion by April 2026.

sol price

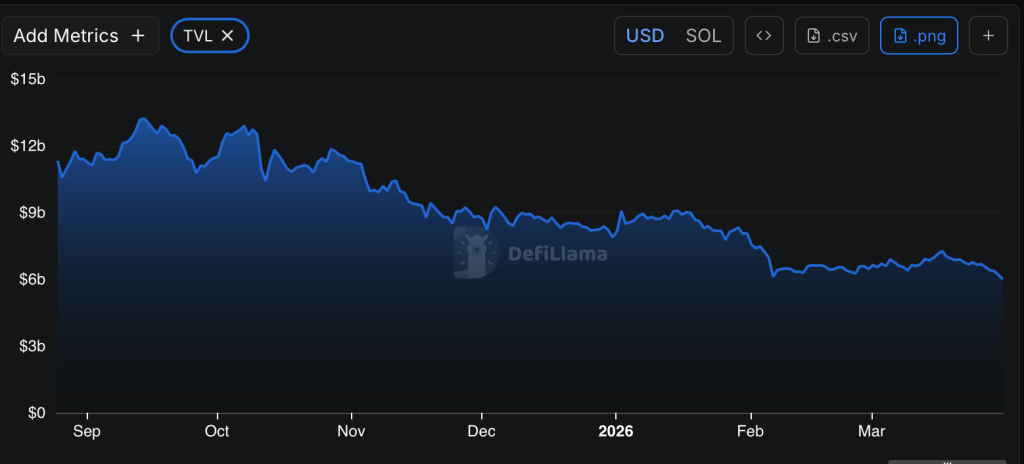
This consistent drop in locked value suggests that capital has been gradually exiting the ecosystem rather than rotating within it, a key signal that underlying demand remains weak despite periods of price consolidation.

Solana Active Addresses Decline Points to Weak Network Activity

Beyond liquidity trends, Solana’s network activity also reflects a cooling phase. Data shows that monthly active addresses have dropped significantly from peak levels above 100 million in mid-2025 to nearly 34 million recently.

sol price

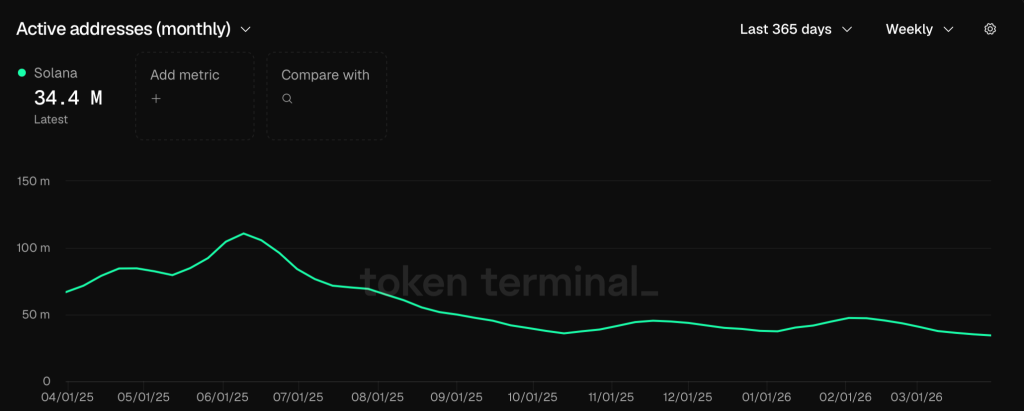
This steady decline highlights a reduction in user engagement, suggesting that fewer participants are actively interacting with the network compared to previous months. When this metric declines alongside TVL, it strengthens the case that the ecosystem is experiencing a slowdown rather than expansion.

Solana Revenue Drops, Reflecting Slowing Economic Activity

Another critical on-chain signal comes from Solana’s revenue, which has been steadily declining over recent months. After peaking above $1 million in mid-to-late 2025, weekly revenue has now dropped significantly, with recent figures hovering near the lower end of the range.

sol price

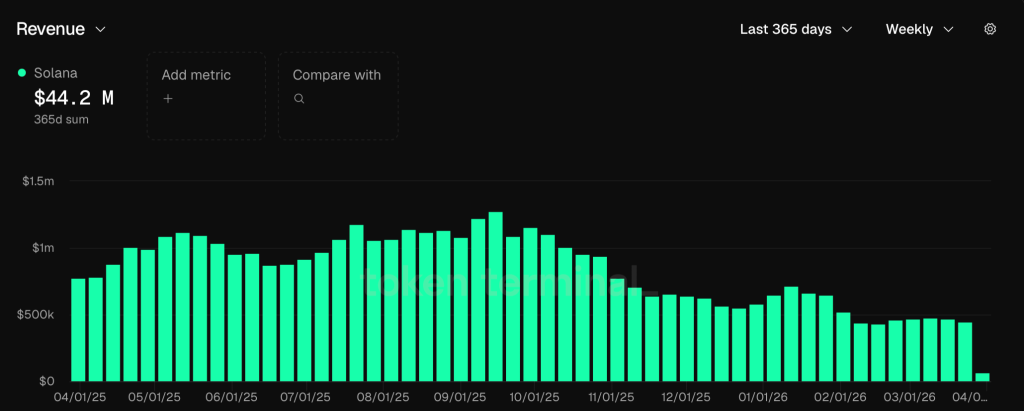
This decline in revenue indicates reduced economic activity across the network, as fewer transactions and lower demand translate directly into weaker fee generation.

How Will This Impact SOL Price as Descending Channel Keeps Bears in Control

Solana price continues to trade within a descending channel, with the price hovering near the lower boundary around $82, indicating a critical decision zone. The overall structure remains bearish, marked by consistent lower highs and weak follow-through from buyers. Indicators like RSI and MACD also reflect a lack of strong momentum, suggesting that bulls are yet to regain control. 

sol price

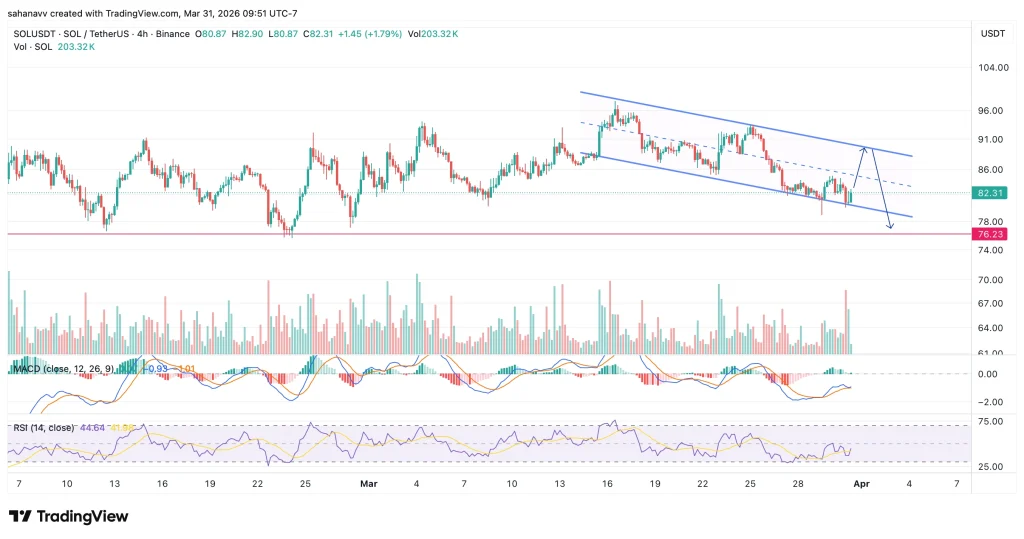
If SOL fails to hold the $80–$78 support range, a breakdown toward $76 appears likely, especially as on-chain data—including declining TVL, active addresses, and revenue—continues to signal weakening demand.

On the other hand, a potential recovery could emerge if Solana (SOL) price manages to reclaim the $86–$90 resistance zone, which may trigger a short-term rebound and shift sentiment. However, unless this level is decisively breached, the current trend leans slightly bearish, with price likely to remain under pressure. As a result, waiting for confirmation around key levels may be a more prudent approach rather than anticipating an early breakout.

Market Opportunity
Solana Logo
Solana Price(SOL)
$82.84
$82.84$82.84
+2.43%
USD
Solana (SOL) Live Price Chart
Disclaimer: The articles reposted on this site are sourced from public platforms and are provided for informational purposes only. They do not necessarily reflect the views of MEXC. All rights remain with the original authors. If you believe any content infringes on third-party rights, please contact crypto.news@mexc.com for removal. MEXC makes no guarantees regarding the accuracy, completeness, or timeliness of the content and is not responsible for any actions taken based on the information provided. The content does not constitute financial, legal, or other professional advice, nor should it be considered a recommendation or endorsement by MEXC.

You May Also Like

Ethereum koers toont zeldzaam dubbel koopsignaal en richt zich op $4.550

Ethereum koers toont zeldzaam dubbel koopsignaal en richt zich op $4.550

Connect met Like-minded Crypto Enthusiasts! Connect op Discord! Check onze Discord   Ethereum laat op de uurgrafiek twee opeenvolgende TD Sequential koopsignalen zien. Deze indicator meet uitputting in een trend en geeft vaak een signaal dat de verkoopdruk kan afnemen. Dit dubbele signaal verschijnt rond het niveau van $4.516, waar de ETH prijs kortstondig steun vindt. Dit type formatie komt zelden voor en wordt daarom extra nauwlettend gevolgd. Wat gaat de Ethereum koers hiermee doen? Ethereum koers test steun rond $4.516 De scherpe daling van de Ethereum koers vanaf de prijszone rond $4.800 bracht de ETH prijs in korte tijd naar ongeveer $4.516. Op dit niveau trad duidelijke koopactiviteit op, waardoor de neerwaartse beweging tijdelijk werd gestopt. Het dubbele signaal dat door de TD Sequential indicator is gegenereerd, viel precies samen met dit prijspunt. De TD Sequential is opgebouwd uit negen candles die een trend meetellen. Wanneer de negende candle verschijnt, kan dit duiden op een trendomslag. In dit geval verschenen zelfs twee signalen kort na elkaar, wat aangeeft dat de verkoopdruk mogelijk uitgeput is. Het feit dat dit gebeurde in een zone waar ETH kopers actief bleven, maakt het patroon extra opvallend. TD Sequential just flashed two buy signals for Ethereum $ETH! pic.twitter.com/JPO8EhiEPi — Ali (@ali_charts) September 16, 2025 Welke crypto nu kopen?Lees onze uitgebreide gids en leer welke crypto nu kopen verstandig kan zijn! Welke crypto nu kopen? Fed-voorzitter Jerome Powell heeft aangekondigd dat de rentes binnenkort zomaar eens omlaag zouden kunnen gaan, en tegelijkertijd blijft BlackRock volop crypto kopen, en dus lijkt de markt klaar om te gaan stijgen. Eén vraag komt telkens terug: welke crypto moet je nu kopen? In dit artikel bespreken we de munten die… Continue reading Ethereum koers toont zeldzaam dubbel koopsignaal en richt zich op $4.550 document.addEventListener('DOMContentLoaded', function() { var screenWidth = window.innerWidth; var excerpts = document.querySelectorAll('.lees-ook-description'); excerpts.forEach(function(description) { var excerpt = description.getAttribute('data-description'); var wordLimit = screenWidth wordLimit) { var trimmedDescription = excerpt.split(' ').slice(0, wordLimit).join(' ') + '...'; description.textContent = trimmedDescription; } }); }); Technische indicatoren schetsen herstelkans voor ETH Naast de dubbele koopsignalen verstrekken ook andere indicatoren belangrijke aanwijzingen. Tijdens de daling van de ETH koers waren grote rode candles zichtbaar, maar na de test van $4.516 stabiliseerde de Ethereum koers. Dit wijst op een mogelijke verschuiving in het evenwicht tussen de bears en bulls. Als deze opwaartse beweging doorzet, liggen de eerste weerstanden rond $4.550. Daarboven wacht een sterkere zone rond $4.650. Deze niveaus zijn in eerdere Ethereum sessies al meerdere keren getest. Een doorbraak zou ruimte openen richting de all-time high van ETH rond $4.953. Wanneer de prijs toch opnieuw onder $4.516 zakt, liggen er zones rond $4.500 en $4.450 waar grotere kooporders worden verwacht. Deze niveaus kunnen als een vangnet fungeren, mocht de druk opnieuw toenemen. Marktdynamiek bevestigt technische indicatoren De huidige situatie volgt op een bredere correctie in de cryptomarkt. Verschillende vooraanstaande crypto tokens zagen scherpe koersdalingen, waarna traders op zoek gingen naar signalen voor een mogelijke ommekeer. Dat juist Ethereum nu een dubbel TD Sequential signaal toont, versterkt de interesse in dit scenario. Fundamenteel blijft Ethereum sterk. Het aantal ETH tokens dat via staking is vastgezet, blijft groeien. Dat verkleint de vrije circulatie en vermindert verkoopdruk. Tegelijk blijft het netwerk intensief gebruikt voor DeFi, NFT’s en stablecoins. Deze activiteiten zorgen voor een stabiele vraag naar ETH, ook wanneer de prijs tijdelijk onder druk staat. Fundamentele drijfveren achter de Ethereum koers De Ethereum koers wordt echter niet alleen bepaald door candles en patronen, maar ook door bredere factoren. Een stijgend percentage van de totale ETH supply staat vast in staking contracten. Hierdoor neemt de liquiditeit op exchanges af. Dit kan prijsschommelingen versterken wanneer er plotseling meer koopdruk ontstaat. Daarnaast is Ethereum nog steeds het grootste smart contract platform. Nieuwe standaarden zoals ERC-8004 en ontwikkelingen rond layer-2 oplossingen houden de activiteit hoog. Deze technologische vooruitgang kan de waardepropositie ondersteunen en zo indirect bijdragen aan een ETH prijsherstel. Het belang van de korte termijn dynamiek De komende handelsdagen zullen duidelijk maken of de bulls genoeg kracht hebben om door de weerstandszone rond $4.550 te breken. Voor de bears ligt de focus juist op het verdedigen van de prijsregio rond $4.516. De whales, die met grote handelsorders opereren, kunnen hierin een beslissende rol spelen. Het dubbele TD Sequential signaal blijft hoe dan ook een zeldzame gebeurtenis. Voor cryptoanalisten vormt het een objectief aanknopingspunt om de kracht van de huidige Ethereum trend te toetsen. Vooruitblik op de ETH koers Ethereum liet twee opeenvolgende TD Sequential signalen zien op de uurgrafiek, iets wat zelden voorkomt. Deze formatie viel samen met steun rond $4.516, waar de bulls actief werden. Als de Ethereum koers boven dit niveau blijft, kan er ruimte ontstaan richting $4.550 en mogelijk $4.650. Zakt de prijs toch opnieuw onder $4.516, dan komen $4.500 en $4.450 in beeld als nieuwe steunzones. De combinatie van zeldzame indicatoren en een sterke fundamentele basis maakt Ethereum interessant voor zowel technische als fundamentele analyses. Of de bulls het momentum echt kunnen overnemen, zal blijken zodra de Ethereum koers de eerstvolgende weerstanden opnieuw test. Koop je crypto via Best Wallet Best wallet is een topklasse crypto wallet waarmee je anoniem crypto kan kopen. Met meer dan 60 chains gesupport kan je al je main crypto coins aanschaffen via Best Wallet. Best wallet - betrouwbare en anonieme wallet Best wallet - betrouwbare en anonieme wallet Meer dan 60 chains beschikbaar voor alle crypto Vroege toegang tot nieuwe projecten Hoge staking belongingen Lage transactiekosten Best wallet review Koop nu via Best Wallet Let op: cryptocurrency is een zeer volatiele en ongereguleerde investering. Doe je eigen onderzoek. Het bericht Ethereum koers toont zeldzaam dubbel koopsignaal en richt zich op $4.550 is geschreven door Dirk van Haaster en verscheen als eerst op Bitcoinmagazine.nl.
Share
Coinstats2025/09/17 23:31
Bitcoin & Ethereum Inflows Hit 1-Year Low as Crypto Investors Brace for Fed Decision – BTC Eyes $120K

Bitcoin & Ethereum Inflows Hit 1-Year Low as Crypto Investors Brace for Fed Decision – BTC Eyes $120K

Bitcoin and Ethereum exchange inflows have dropped to a 1-year low indicating reduced selling pressure and investor reluctance to exit positions ahead of a potential U.S. Federal Reserve rate cut, with on-chain data revealing exchange inflows falling to a 7-day moving average of 25K BTC from 51K BTC in July.
Share
Coinstats2025/09/17 23:29
Nav3 Router: Convenient Navigation on Top of Jetpack Navigation 3

Nav3 Router: Convenient Navigation on Top of Jetpack Navigation 3

Jetpack Navigation 3 is a new Google navigation library that is fundamentally different from previous versions. The main idea of Nav3 is simple: you have a NavBackStack — a regular mutable list where each element represents a screen in your application.
Share
Hackernoon2025/09/17 20:00