Ethereum Nears $3K As Trend Research’s Jack Yi Plans $1B ETH Buy, Warns Against Shorting
The Ethereum price edged up over 1% in the past 24 hours to trade at $2,963.47 as of 11:57 a.m. EST, with trading volume surging 24% to $15.7 billion.
This comes as Jack Yi, founder of Trend Research, announced on X that his firm is planning a $1 billion allocation to bolster its Ethereum holdings, which now intensifies its market presence.
The move comes amid considerable institutional confidence in Ethereum’s future growth and could significantly impact the Ethereum market dynamics. As a result, it captures attention amid ongoing investment strategies and market volatility.
The decision to invest in ETH aims to bolster the firm’s substantial holdings. Jack Yi emphasized the firm’s commitment to Ethereum, warning against short-selling, which aligns with Trend Research’s ongoing strategy of buying ETH during price dips.
These substantial investments are a reflection of many institutions’ belief in the token’s long-term value, reinforcing confidence among other institutional investors and potentially stabilizing prices.
Meanwhile, this move could herald a larger trend of institutional interest in ETH, potentially affecting market structure and regulatory perspectives.
Ethereum Price Struggles For Direction As Key Indicators Signal Indecision
The ETH price action has shifted into a corrective phase after staging a strong rally from the mid-2024 support region near $2,100.
That push propelled the Ethereum price toward a cycle peak around $4,900, where buying momentum began to fade, and profit-taking emerged.
Following the rejection at the highs, Ethereum entered a prolonged pullback, carving out a rounded top pattern and slipping back toward its long-term trend support. This retracement has dragged the price below both the 50-day and 200-day Simple Moving Averages (SMAs), which now act as the immediate resistance levels.
Meanwhile, the Relative Strength Index (RSI) is hovering around 40, suggesting subdued momentum without reaching oversold conditions. This level reflects a balance between buyers and sellers, reinforcing the idea that Ethereum is consolidating rather than trending aggressively in either direction.
Meanwhile, the Moving Average Convergence Divergence (MACD) indicator continues to trade below the zero line, but downside momentum is weakening. The histogram bars are contracting, signaling that bearish pressure is losing strength.
Although no decisive bullish crossover has yet formed, this behavior often precedes a stabilization phase or short-term relief bounce.
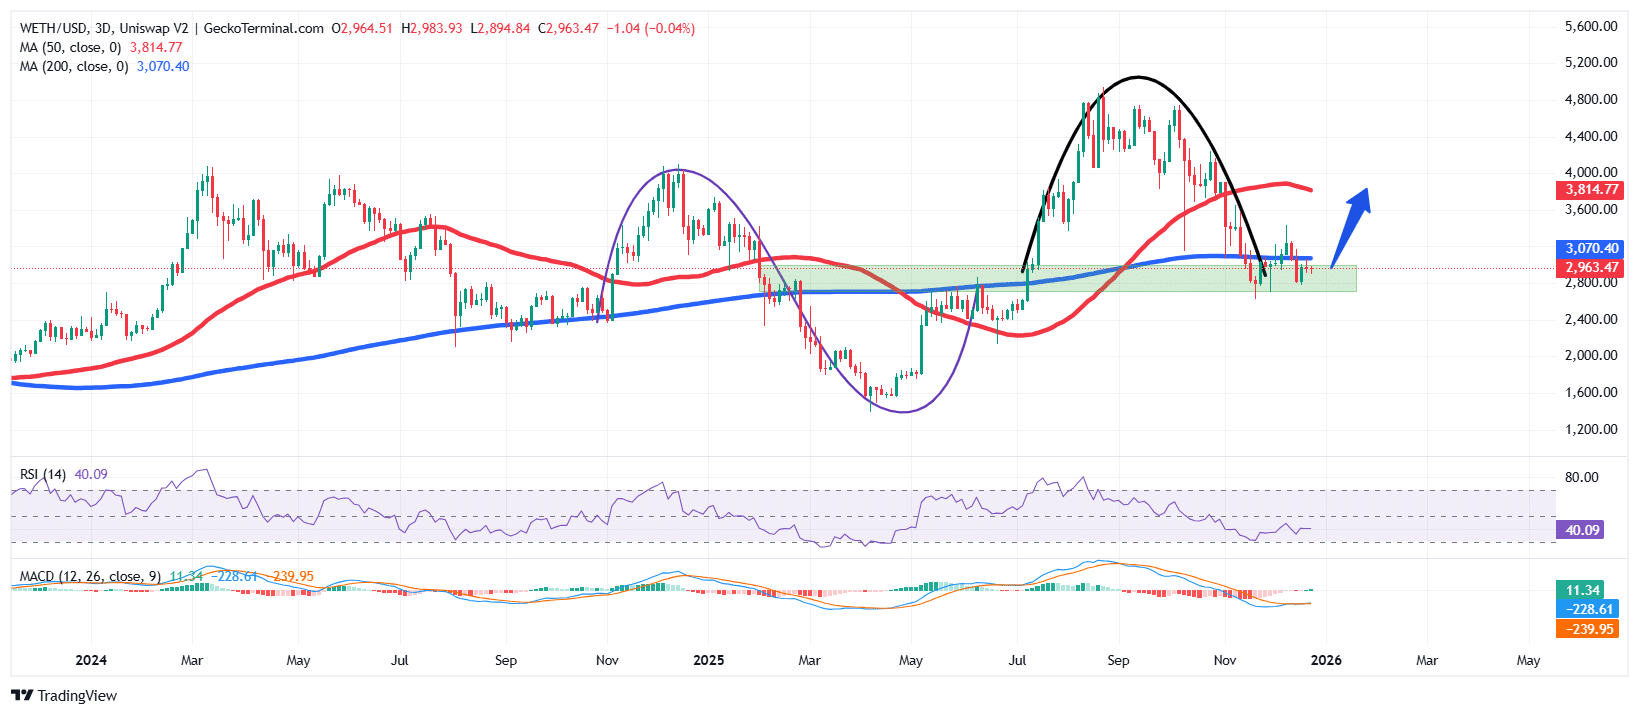 ETH/USD Chart Analysis Source: GeckoTerminal
ETH Price At A Decision Zone
Based on the ETH/USD chart on the higher timeframe, the ETH price is at a make-or-break level. The confluence of the 200 MA and horizontal support between $2,900–$3,050 forms a critical demand zone that bulls must defend.
A clean breakdown below this support region could expose the price of Ethereum to a deeper move toward the next major demand zone near $2,700, with extended weakness potentially revisiting the broader base around $2,100–$2,200.
Conversely, if buyers successfully defend the 200-day SMA and momentum stabilizes, the price of ETH could attempt a recovery toward the prior consolidation range around $3,400–$3,600.
A sustained push above this region would place the 50-day SMA near $3,800 back into focus as the next resistance hurdle.
To add to the bullish case, crypto analyst Ali Martinez says that ETH active addresses have nearly doubled in a week, which is a signal of investors locking in.
Related News:
You May Also Like

Markets await Fed’s first 2025 cut, experts bet “this bull market is not even close to over”

“2026 Will Be The Bull Run 2025 Was Supposed To Be” Analyst Shares Insight ⋆ ZyCrypto