

Crypto News: Top 3 Trending Coins
Key Insights
- Crypto News: This week, Bitcoin is leading the market for the top trending tokens, with PENGU and Solana following closely behind.
- Michael highly favors that BTC finds a higher low at $65K. PENGU is bouncing off a demand zone.
- If seller momentum continues, Solana price could hit $50.22, $22.47, or even $9.98.
The market has slightly bounced in the last few days following Jane Street’s lawsuit and ZachXBT’s exposé of Axiom. The two brought confidence back as ‘10AM manipulation’ was dodged, leading to positive sentiment. Traders on social media expressed relief following the lawsuit that saw the markets move organically.
On the top trending coins for this week, Bitcoin (BTC) led with Pudgy Penguins (PENGU) and Solana (SOL) following closely behind. This showed that participants were discussing the tokens more than their counterparts.
Interestingly, the distribution of this trend was wholesome, with even memecoins also represented by PENGU. Other notable cryptos that made it to the top 20 were Ethereum (ETH), Hyperliquid (HYPE), Sui Network (SUI), and Polkadot (DOT), among others.
 Weekly top trending tokens | Source: CoinGecko
The AI sector was also represented by Pippin (PIPPIN), which is a utility memecoin, and Bittensor (TAO), which is a Layer 1 blockchain. Generally, the list was well-distributed, great for those who liked to diversify their portfolios.
But what did the charts for the top 3 trending tokens look like?
Bitcoin Price Prediction: Can $65K Hold for a Move to $75K?
On the charts, Bitcoin price continued to bleed as its value continued to trade below $70,000. However, it was bouncing off the $65K, which was an important support level. This was after sweeping liquidity around the lows at $65K.
According to Michael van de Poppe, the market bounced after this move. He highly favored that Bitcoin held above $65K as a higher low. The move would mean reverting to a bullish trend up to around the zone between $74K and $75K.
 Bitcoin price action chart | Source: Michael van de Poppe/X
However, the analyst still sent a caution, as history usually repeats, though not all the time.
Michael noted that the market was entering the last day of the month, and just like last month, the market could collapse. He still noted that a hold above $65K would see BTC rise from where it was trading at press time.
PENGU Price Prediction: Can Memecoin Confidence Be Restored?
PENGU, on the other hand, was bouncing off a demand zone around $0.0060, though it had hit a reversal point just above $0.0073 on the 4-hour chart. The MACD was in the red, suggesting a lack of strength from buyers in the market.
Holding the current level of $0.0068 as a higher low could help push PENGU to $0.0079. Otherwise, the memecoin would continue dropping toward the demand zone as it seemed to be in a sideways range.
 PENGU price action chart | Source: TradingView
With PENGU representing memecoins alongside PIPPIN, it showed that the Axiom exposé played a part in sentiment. This indicated a potential restoration of memecoin confidence.
Furthermore, it stressed the position of memecoins in crypto, despite constant scrutiny and backlash. All this happened especially when the sector was faced with manipulation, forced liquidations, and insider trading.
Solana Price Prediction: Can $87 Hold Long Enough?
Meanwhile, Ali Charts did a pessimistic analysis of Solana’s price action. This could also be true based on the history of the previous bear market. The analyst noted that if selling momentum continues, the SOL price may drop to $50, $22, or even below $10.
At the time of writing, the weekly chart showed a free fall, with the price of Solana trading toward $50.
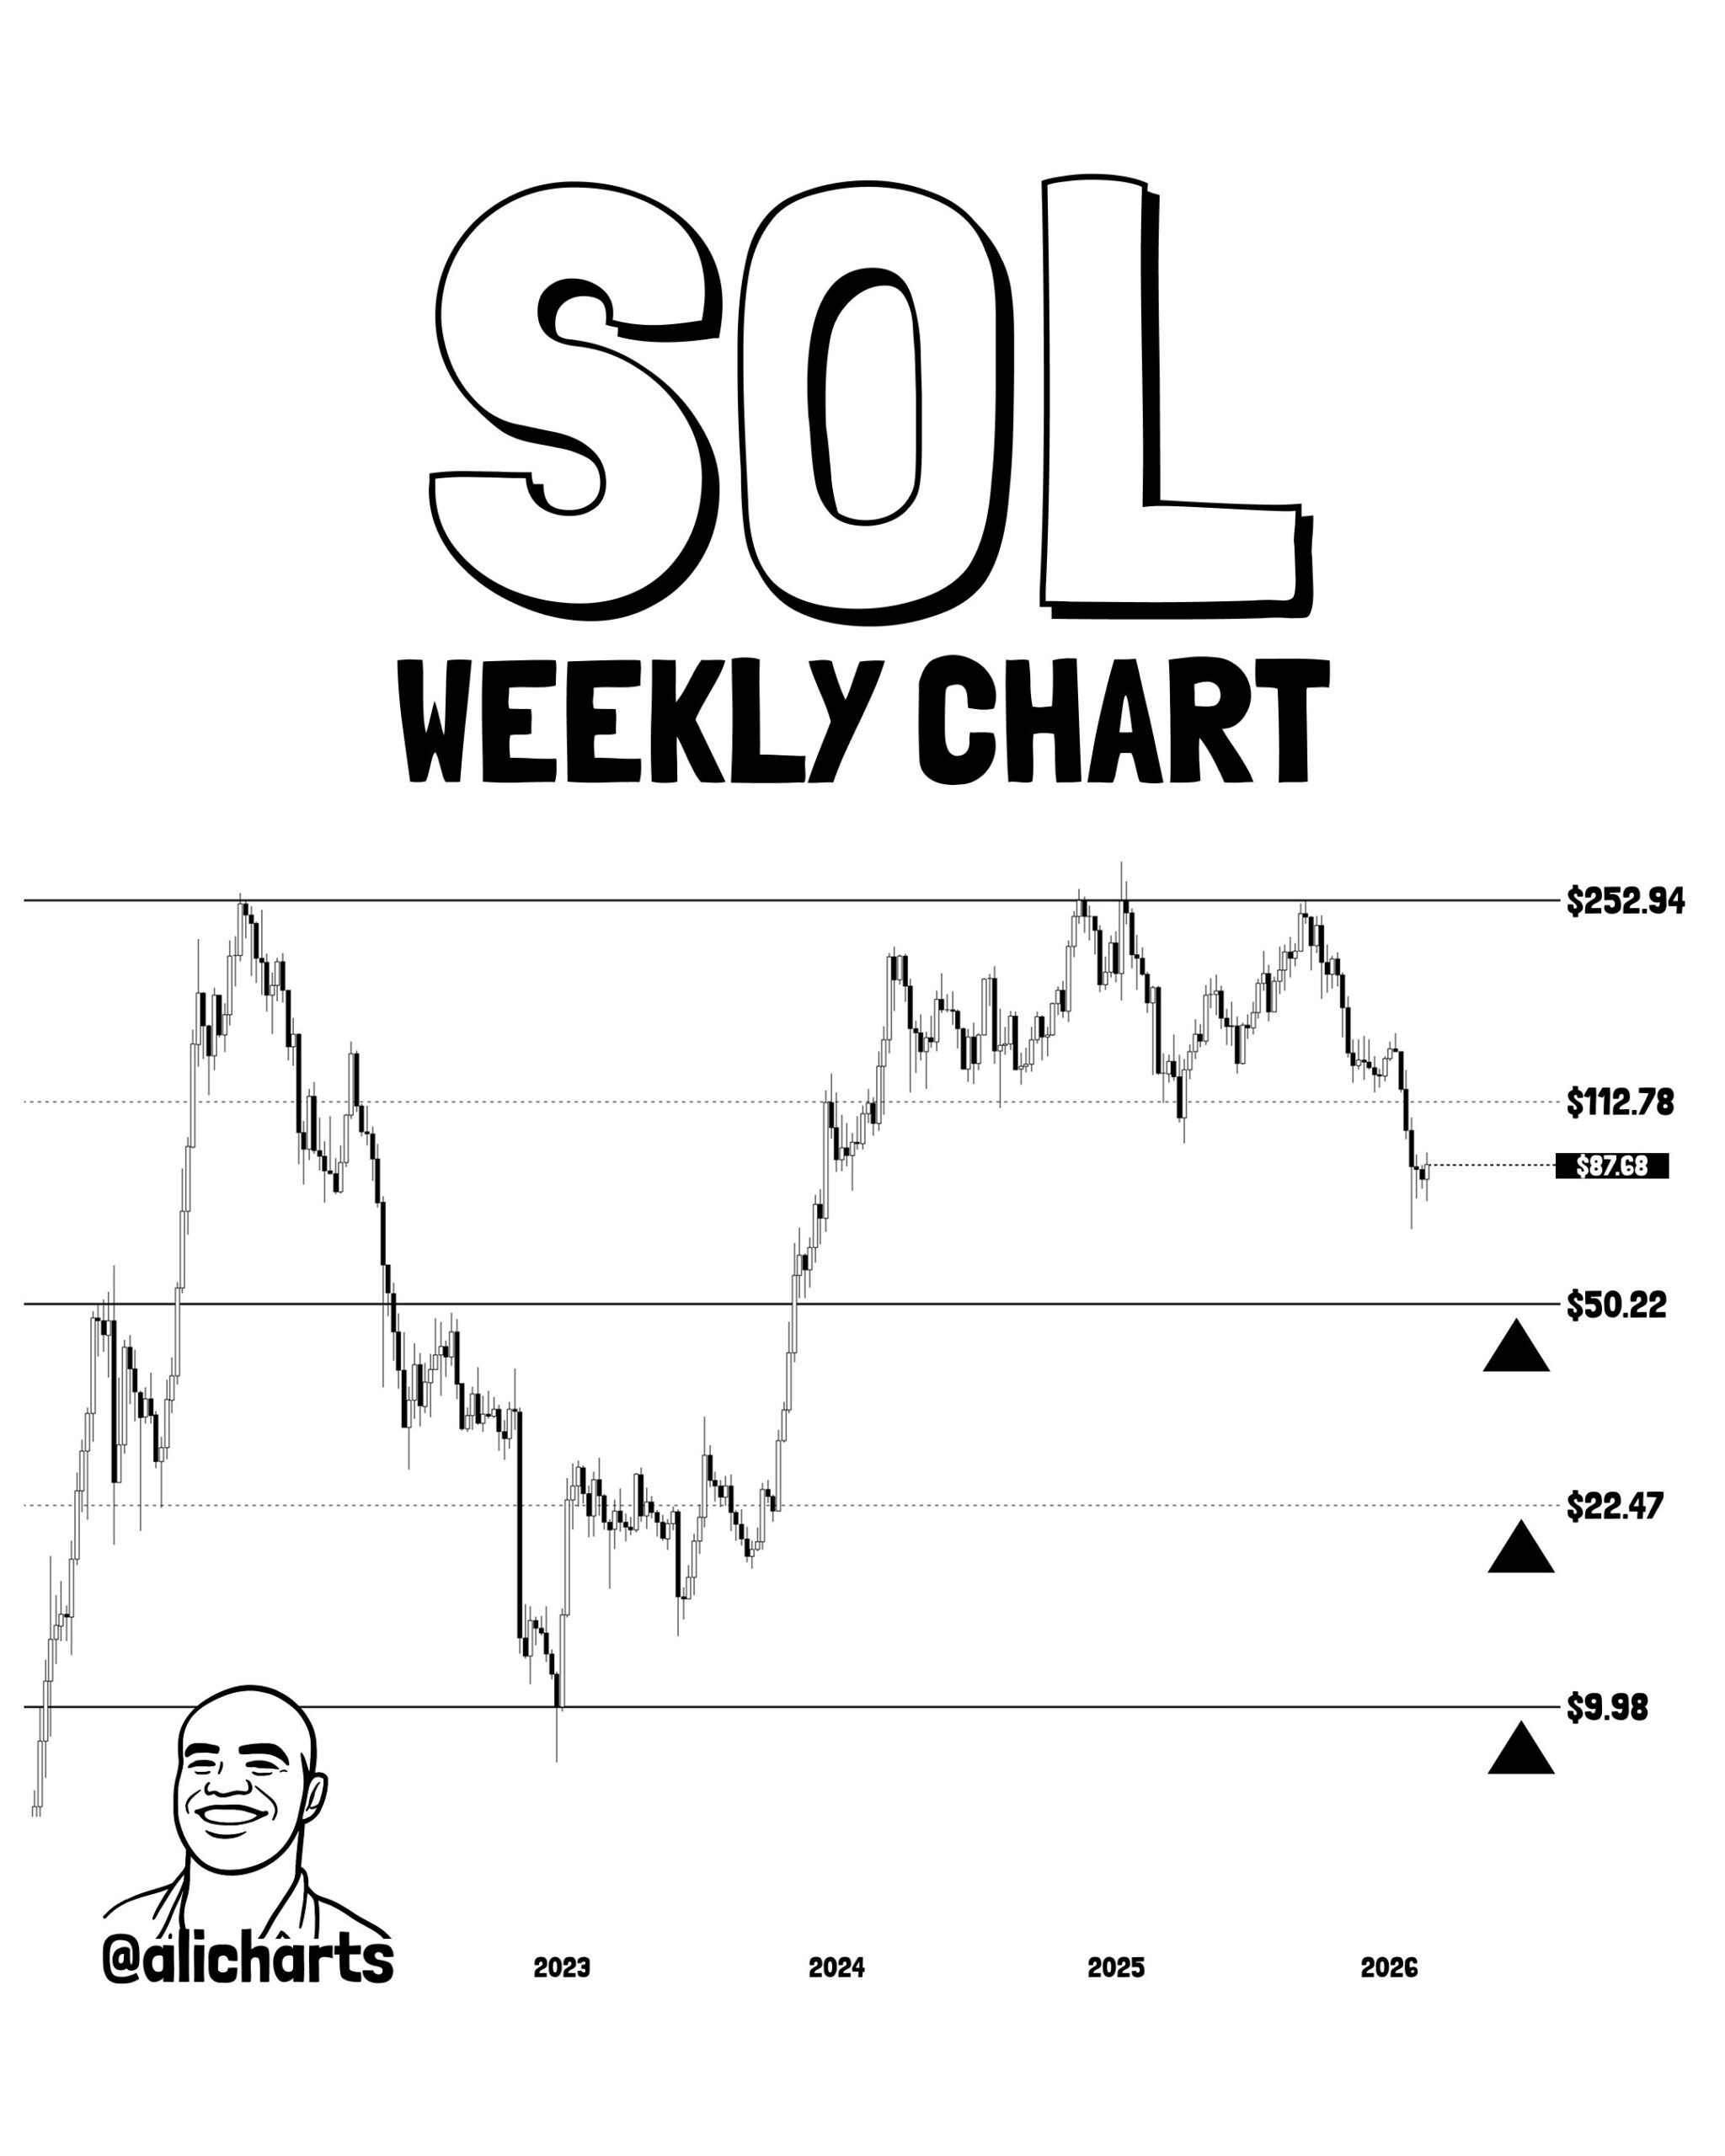 Solana price action on weekly chart | Source: Ali Charts/X
However, it was holding around $87, as the movement of the last four candles was stagnant. This meant Solana had spent more than a month trying to break below the level, hence, a strong zone. That could mean that SOL might also reverse from here if conditions improved.
The post Crypto News: Top 3 Trending Coins appeared first on The Market Periodical.
You May Also Like

Polygon Tops RWA Rankings With $1.1B in Tokenized Assets

Dormant Bitcoin Giant Stirs, Moves 1,000 BTC After Decade in Hiding
