As of June 14, the likelihood of Iran blocking or closing the Strait of Hormuz has risen to 47%, nearly doubling from 24% on June 11. Strait of Hormuz Closure Threatens Global Trade The odds of Iran blocking or closing the Strait of Hormuz, one of the world’s most critical maritime chokepoints, briefly rose to […]As of June 14, the likelihood of Iran blocking or closing the Strait of Hormuz has risen to 47%, nearly doubling from 24% on June 11. Strait of Hormuz Closure Threatens Global Trade The odds of Iran blocking or closing the Strait of Hormuz, one of the world’s most critical maritime chokepoints, briefly rose to […]

Polymarket Data: Strait of Hormuz Closure Odds Nearly Double After Israel’s Strikes on Iran

As of June 14, the likelihood of Iran blocking or closing the Strait of Hormuz has risen to 47%, nearly doubling from 24% on June 11.

Strait of Hormuz Closure Threatens Global Trade

The odds of Iran blocking or closing the Strait of Hormuz, one of the world’s most critical maritime chokepoints, briefly rose to 45% on June 14, according to the latest Polymarket data. The data shows the odds are nearly double the 24% observed on June 11, hours before Israel finally acted on its longstanding threat to hit Iran’s nuclear sites.

Polymarket Data: Strait of Hormuz Closure Odds Nearly Double After Israel’s Strikes on Iran
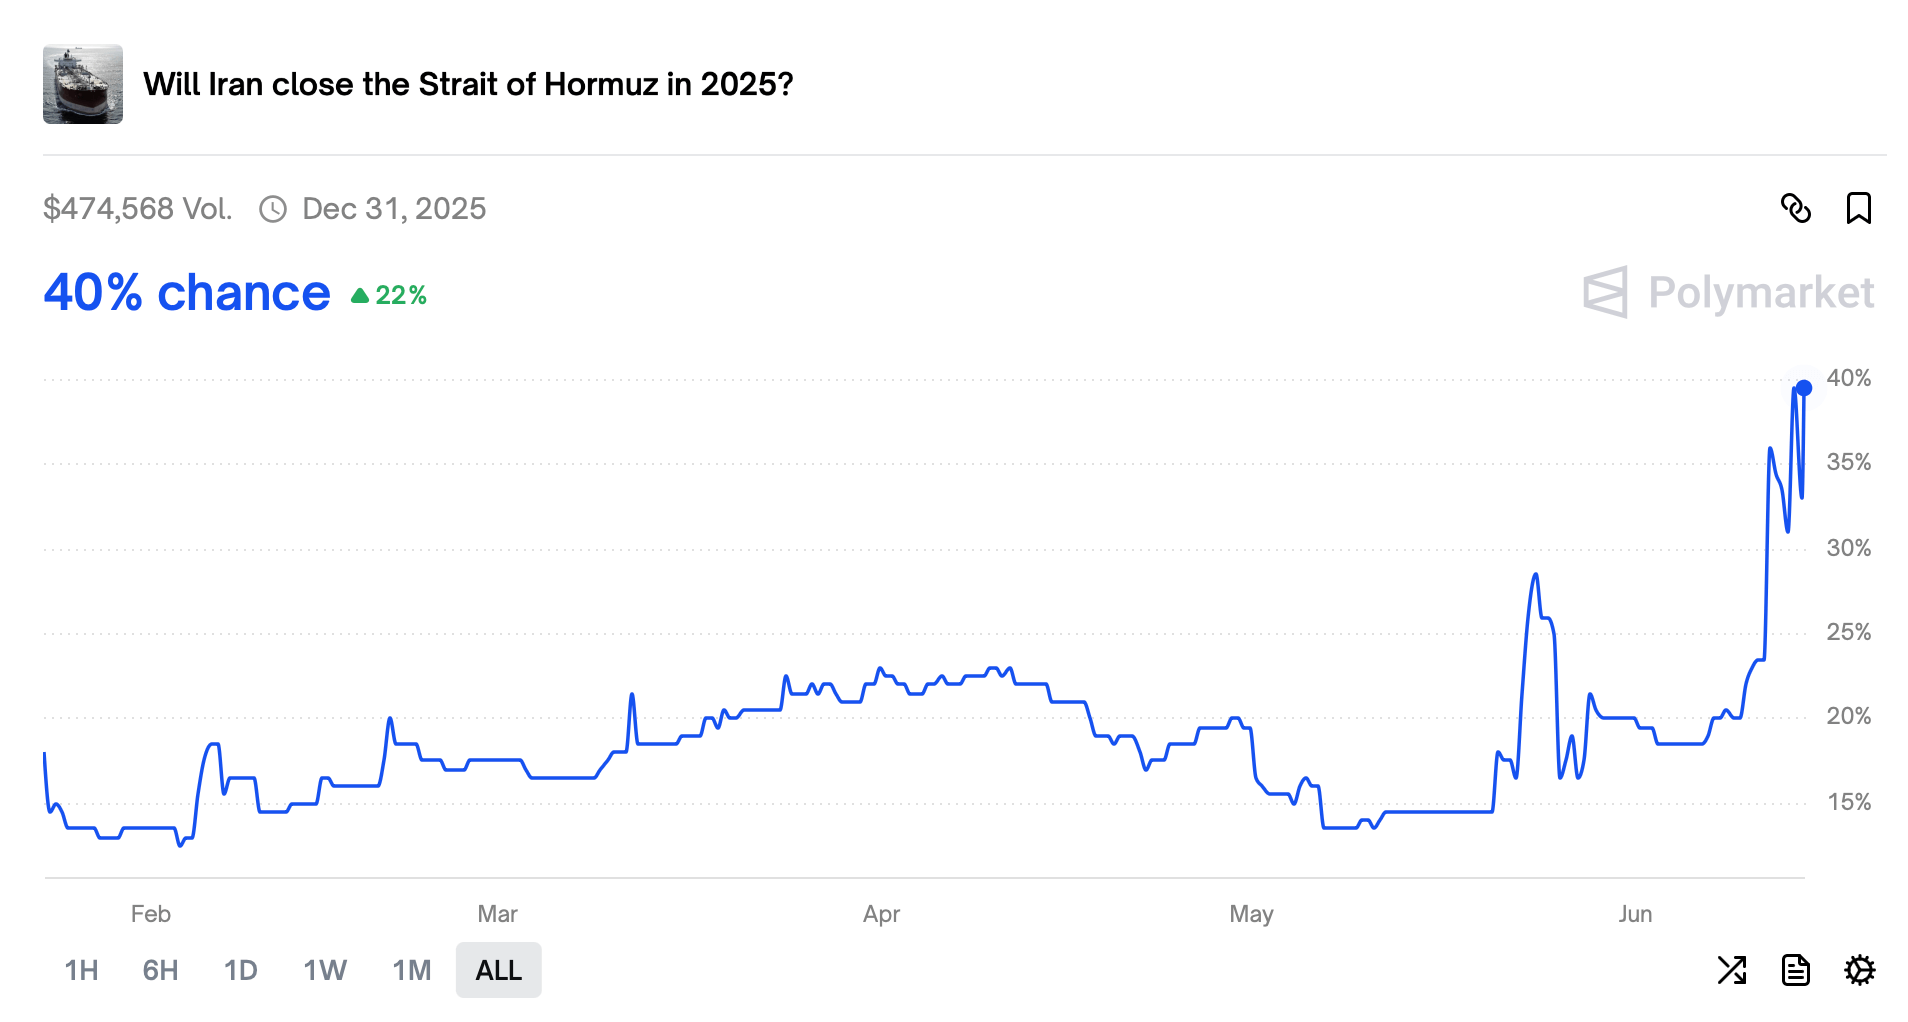
Polymarket bet data on June 14, 2025.

Although Iran has never fully carried out the threat before, many fear the scale of Israel’s strikes may prompt Tehran to retaliate by closing the critical chokepoint. The Strait of Hormuz is said to be vital for global trade because roughly one-fifth to one-third of the world’s total oil consumption — estimated between 17 million and 21 million barrels per day — passes through it.

In addition, a significant portion of global liquefied natural gas (LNG) trade, especially from Qatar and the United Arab Emirates (UAE), also transits the shipping channel. Many experts fear its closure or any disruption, even temporary, would cause oil prices to surge dramatically, potentially pushing Brent crude well above $100-$120 per barrel.

Shortly after Israeli warplanes struck targets in Iran, oil prices surged past the $70 per barrel mark for the first time since April 3, 2025. Some observers fear the closure of the channel could lead to even higher oil prices and potential economic stagnation for many countries that rely on the Strait of Hormuz.

The surge in the odds meanwhile points to growing fears that the latest tit-for-tat military attacks between Tehran and Tel Aviv will escalate into a full-blown war. In the last exchange between the two bitter enemies, the strikes appeared to be choreographed, with both Israel and Iran reportedly getting advance warning of the pending strikes. At the time, both countries appeared not to cross red lines set by either, resulting in the confrontation ending with limited damage.

In Israel’s latest strikes, Iranian nuclear sites, including one in Natanz, were struck, with the International Atomic Energy Agency (IAEA) reporting that the above-ground enrichment plant was completely destroyed. Many global mainstream media outlets reported that Iran’s air defenses were also destroyed during the dawn strikes, although such reports appeared to be undercut by videos circulating on social media purporting to show these defenses engaging incoming missiles.

Attacks on nuclear sites and other vital infrastructure suggest that Israel has crossed Tehran’s red line, an act that increases the prospects of Iran finally acting on its threat. However, closing the chokepoint would devastate Iran’s own economy and may provoke a response by other countries dependent on it, including the United States.

Disclaimer: The articles reposted on this site are sourced from public platforms and are provided for informational purposes only. They do not necessarily reflect the views of MEXC. All rights remain with the original authors. If you believe any content infringes on third-party rights, please contact service@support.mexc.com for removal. MEXC makes no guarantees regarding the accuracy, completeness, or timeliness of the content and is not responsible for any actions taken based on the information provided. The content does not constitute financial, legal, or other professional advice, nor should it be considered a recommendation or endorsement by MEXC.

You May Also Like

Uniswap stemt in met token burn van 100 miljoen UNI

Uniswap stemt in met token burn van 100 miljoen UNI

Uniswap (UNI) heeft een belangrijke stap gezet in de verdere ontwikkeling van zijn tokenomics. In een recente governance-stemming hebben houders van het UNI-token
Share
Coinstats2025/12/26 21:47
Which Crypto to Buy Today for Long-Term Growth? One DeFi Crypto Stands Out

Which Crypto to Buy Today for Long-Term Growth? One DeFi Crypto Stands Out

The post Which Crypto to Buy Today for Long-Term Growth? One DeFi Crypto Stands Out appeared on BitcoinEthereumNews.com. Crypto Projects Investors searching for
Share
BitcoinEthereumNews2025/12/26 22:32
Ethereum koers toont zeldzaam dubbel koopsignaal en richt zich op $4.550

Ethereum koers toont zeldzaam dubbel koopsignaal en richt zich op $4.550

Connect met Like-minded Crypto Enthusiasts! Connect op Discord! Check onze Discord   Ethereum laat op de uurgrafiek twee opeenvolgende TD Sequential koopsignalen zien. Deze indicator meet uitputting in een trend en geeft vaak een signaal dat de verkoopdruk kan afnemen. Dit dubbele signaal verschijnt rond het niveau van $4.516, waar de ETH prijs kortstondig steun vindt. Dit type formatie komt zelden voor en wordt daarom extra nauwlettend gevolgd. Wat gaat de Ethereum koers hiermee doen? Ethereum koers test steun rond $4.516 De scherpe daling van de Ethereum koers vanaf de prijszone rond $4.800 bracht de ETH prijs in korte tijd naar ongeveer $4.516. Op dit niveau trad duidelijke koopactiviteit op, waardoor de neerwaartse beweging tijdelijk werd gestopt. Het dubbele signaal dat door de TD Sequential indicator is gegenereerd, viel precies samen met dit prijspunt. De TD Sequential is opgebouwd uit negen candles die een trend meetellen. Wanneer de negende candle verschijnt, kan dit duiden op een trendomslag. In dit geval verschenen zelfs twee signalen kort na elkaar, wat aangeeft dat de verkoopdruk mogelijk uitgeput is. Het feit dat dit gebeurde in een zone waar ETH kopers actief bleven, maakt het patroon extra opvallend. TD Sequential just flashed two buy signals for Ethereum $ETH! pic.twitter.com/JPO8EhiEPi — Ali (@ali_charts) September 16, 2025 Welke crypto nu kopen?Lees onze uitgebreide gids en leer welke crypto nu kopen verstandig kan zijn! Welke crypto nu kopen? Fed-voorzitter Jerome Powell heeft aangekondigd dat de rentes binnenkort zomaar eens omlaag zouden kunnen gaan, en tegelijkertijd blijft BlackRock volop crypto kopen, en dus lijkt de markt klaar om te gaan stijgen. Eén vraag komt telkens terug: welke crypto moet je nu kopen? In dit artikel bespreken we de munten die… Continue reading Ethereum koers toont zeldzaam dubbel koopsignaal en richt zich op $4.550 document.addEventListener('DOMContentLoaded', function() { var screenWidth = window.innerWidth; var excerpts = document.querySelectorAll('.lees-ook-description'); excerpts.forEach(function(description) { var excerpt = description.getAttribute('data-description'); var wordLimit = screenWidth wordLimit) { var trimmedDescription = excerpt.split(' ').slice(0, wordLimit).join(' ') + '...'; description.textContent = trimmedDescription; } }); }); Technische indicatoren schetsen herstelkans voor ETH Naast de dubbele koopsignalen verstrekken ook andere indicatoren belangrijke aanwijzingen. Tijdens de daling van de ETH koers waren grote rode candles zichtbaar, maar na de test van $4.516 stabiliseerde de Ethereum koers. Dit wijst op een mogelijke verschuiving in het evenwicht tussen de bears en bulls. Als deze opwaartse beweging doorzet, liggen de eerste weerstanden rond $4.550. Daarboven wacht een sterkere zone rond $4.650. Deze niveaus zijn in eerdere Ethereum sessies al meerdere keren getest. Een doorbraak zou ruimte openen richting de all-time high van ETH rond $4.953. Wanneer de prijs toch opnieuw onder $4.516 zakt, liggen er zones rond $4.500 en $4.450 waar grotere kooporders worden verwacht. Deze niveaus kunnen als een vangnet fungeren, mocht de druk opnieuw toenemen. Marktdynamiek bevestigt technische indicatoren De huidige situatie volgt op een bredere correctie in de cryptomarkt. Verschillende vooraanstaande crypto tokens zagen scherpe koersdalingen, waarna traders op zoek gingen naar signalen voor een mogelijke ommekeer. Dat juist Ethereum nu een dubbel TD Sequential signaal toont, versterkt de interesse in dit scenario. Fundamenteel blijft Ethereum sterk. Het aantal ETH tokens dat via staking is vastgezet, blijft groeien. Dat verkleint de vrije circulatie en vermindert verkoopdruk. Tegelijk blijft het netwerk intensief gebruikt voor DeFi, NFT’s en stablecoins. Deze activiteiten zorgen voor een stabiele vraag naar ETH, ook wanneer de prijs tijdelijk onder druk staat. Fundamentele drijfveren achter de Ethereum koers De Ethereum koers wordt echter niet alleen bepaald door candles en patronen, maar ook door bredere factoren. Een stijgend percentage van de totale ETH supply staat vast in staking contracten. Hierdoor neemt de liquiditeit op exchanges af. Dit kan prijsschommelingen versterken wanneer er plotseling meer koopdruk ontstaat. Daarnaast is Ethereum nog steeds het grootste smart contract platform. Nieuwe standaarden zoals ERC-8004 en ontwikkelingen rond layer-2 oplossingen houden de activiteit hoog. Deze technologische vooruitgang kan de waardepropositie ondersteunen en zo indirect bijdragen aan een ETH prijsherstel. Het belang van de korte termijn dynamiek De komende handelsdagen zullen duidelijk maken of de bulls genoeg kracht hebben om door de weerstandszone rond $4.550 te breken. Voor de bears ligt de focus juist op het verdedigen van de prijsregio rond $4.516. De whales, die met grote handelsorders opereren, kunnen hierin een beslissende rol spelen. Het dubbele TD Sequential signaal blijft hoe dan ook een zeldzame gebeurtenis. Voor cryptoanalisten vormt het een objectief aanknopingspunt om de kracht van de huidige Ethereum trend te toetsen. Vooruitblik op de ETH koers Ethereum liet twee opeenvolgende TD Sequential signalen zien op de uurgrafiek, iets wat zelden voorkomt. Deze formatie viel samen met steun rond $4.516, waar de bulls actief werden. Als de Ethereum koers boven dit niveau blijft, kan er ruimte ontstaan richting $4.550 en mogelijk $4.650. Zakt de prijs toch opnieuw onder $4.516, dan komen $4.500 en $4.450 in beeld als nieuwe steunzones. De combinatie van zeldzame indicatoren en een sterke fundamentele basis maakt Ethereum interessant voor zowel technische als fundamentele analyses. Of de bulls het momentum echt kunnen overnemen, zal blijken zodra de Ethereum koers de eerstvolgende weerstanden opnieuw test. Koop je crypto via Best Wallet Best wallet is een topklasse crypto wallet waarmee je anoniem crypto kan kopen. Met meer dan 60 chains gesupport kan je al je main crypto coins aanschaffen via Best Wallet. Best wallet - betrouwbare en anonieme wallet Best wallet - betrouwbare en anonieme wallet Meer dan 60 chains beschikbaar voor alle crypto Vroege toegang tot nieuwe projecten Hoge staking belongingen Lage transactiekosten Best wallet review Koop nu via Best Wallet Let op: cryptocurrency is een zeer volatiele en ongereguleerde investering. Doe je eigen onderzoek. Het bericht Ethereum koers toont zeldzaam dubbel koopsignaal en richt zich op $4.550 is geschreven door Dirk van Haaster en verscheen als eerst op Bitcoinmagazine.nl.
Share
Coinstats2025/09/17 23:31