

Solana (SOL) Price: Drops 5% as U.S.-Israel Launch Strikes on Tehran – Watch These Levels
TLDR
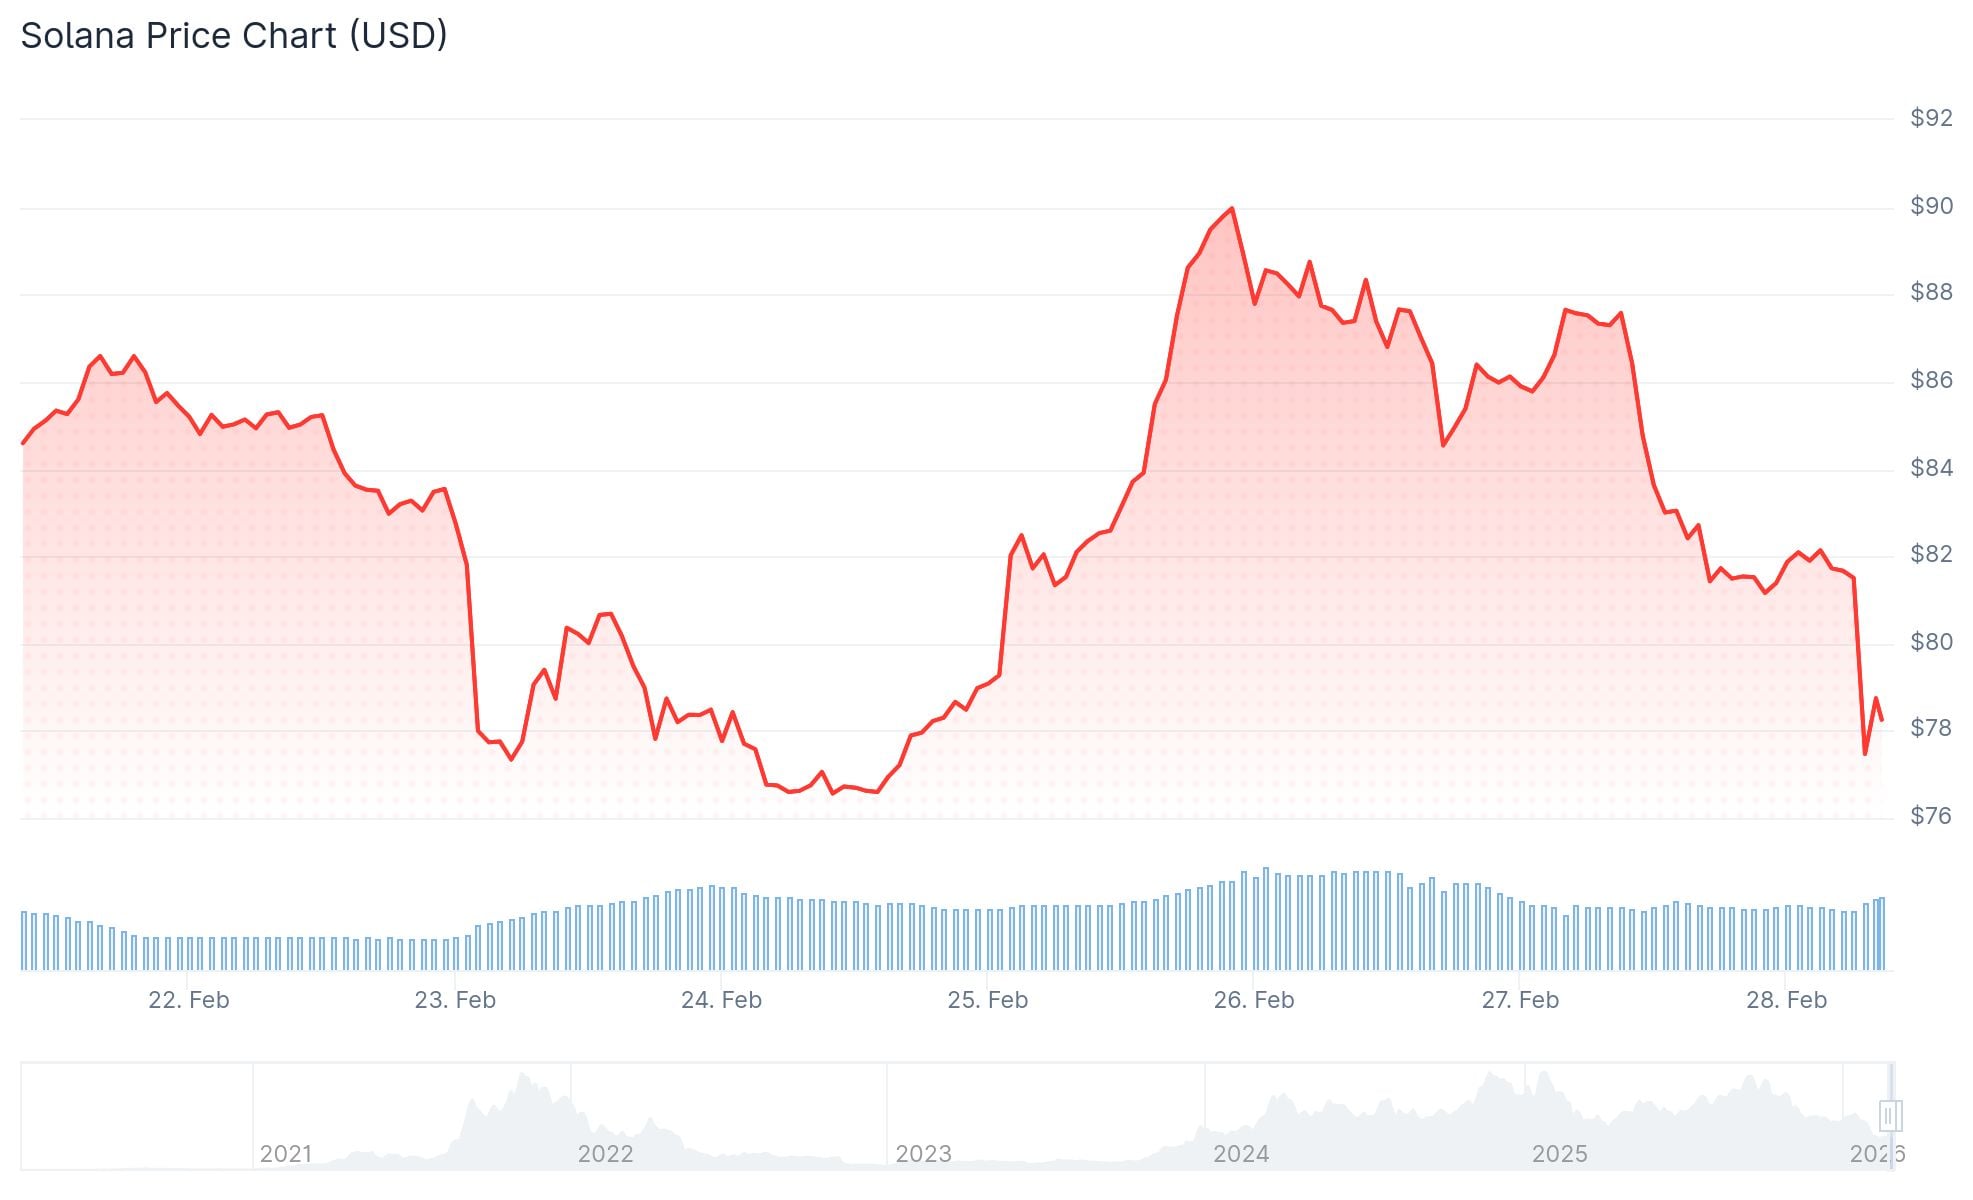
- SOL is down 72% from its all-time high of $295, currently trading around $78
- Spot SOL ETFs have seen minimal outflows ($11.3M) compared to Bitcoin and Ethereum ETFs which logged four consecutive months of negative flows
- Solana led DEX volume over the past 30 days with $108 billion, beating Ethereum’s $63.7 billion
- Key support levels identified at $50, $22, and $10 based on a Parallel Channel pattern
- The Israel-Iran conflict triggered a broader crypto sell-off, pushing Bitcoin toward $60,000 and adding pressure on altcoins like SOL
Solana’s SOL token is currently trading at $78, down 72% from its all-time high of $295. The drop comes during a broader crypto market decline, with geopolitical tensions adding fresh pressure on February 28, 2026.
 Solana (SOL) Price
Israel launched a strike against Iran on Saturday morning local time. The U.S. participated in the attack, according to AP sources. Bitcoin dropped nearly 5% in minutes, falling toward $60,000, and the sell-off hit altcoins including SOL.
Despite the price drop, Solana’s network numbers remain strong. Over the past 30 days, Solana processed $108 billion in DEX volume, ahead of Ethereum’s $63.7 billion and Base’s $31.48 billion.
In the last 24 hours, Solana generated $3.1 million in app revenue versus Ethereum’s $2.95 million. Active addresses on Solana stood at 2.17 million, compared to Ethereum’s 682,236.
Solana’s real-world asset (RWA) sector has reached an all-time high of $1.71 billion, up 45% in 30 days.
SOL ETF Flows Hold Steady
Spot SOL ETFs launched in late October 2025 and pulled in over $100 million in average net inflows during their first five weeks. Weekly inflows have since slowed to $20–$25 million as the price declined.
 Source: SoSoValue
Cumulative outflows across the four-month drawdown total just $11.3 million over two weeks. Bitcoin and Ethereum ETFs, by contrast, logged four consecutive months of negative flows in the same period.
Solana is currently trading well below the $188 level seen at the time of its ETF launch.
Key Support Levels to Watch
Analyst Ali Martinez pointed to a Parallel Channel forming on SOL’s weekly chart. Based on this pattern, support levels sit at $50.22, $22.47, and $9.98.
Analyst Crypto Scient identified two additional areas. The first is the 0.75 Fibonacci retracement zone between $60 and $70. The second is a weekly demand fair value gap between $22 and $29.
UTXO data from Glassnode shows over 6% of SOL supply last moved within the current price cluster. The next major concentration of supply, above 3%, sits between $20 and $30.
SOL is currently trading below the weekly resistance level of $120. The $51 to $80 zone on the weekly chart has been tested and aligns with the retracement pocket analysts are watching.
On February 28, 2026, SOL was trading at $78 as markets reacted to the Israel-Iran conflict.
The post Solana (SOL) Price: Drops 5% as U.S.-Israel Launch Strikes on Tehran – Watch These Levels appeared first on CoinCentral.
You May Also Like

WELIREG® (belzutifan) Plus LENVIMA® (lenvatinib) Reduced the Risk of Disease Progression or Death by 30% Compared to Cabozantinib in Certain Previously Treated Patients With Advanced Renal Cell Carcinoma (RCC)

Why Bitcoin traders have to price tariffs like surprise rate hikes while waiting on social media posts for the next $175B trigger
