

Solana Price Analysis: SOL Slides 5% Amid Middle East Tensions – Critical Support Zones Ahead
TLDR
- SOL has declined 72% from its record high of $295 and is currently valued at approximately $78
- The token’s spot ETF products have experienced only $11.3M in total outflows, significantly less than Bitcoin and Ethereum ETFs that recorded four straight months of withdrawals
- Solana dominated decentralized exchange activity with $108 billion in 30-day volume, surpassing Ethereum’s $63.7 billion
- Technical analysts highlight critical support zones at $50, $22, and $10 derived from Parallel Channel formations
- Military strikes involving Israel and Iran sparked widespread cryptocurrency liquidations, driving Bitcoin near $60,000 and weighing heavily on alternative tokens including SOL
The Solana network’s native token SOL is presently valued at $78, representing a 72% decline from its peak valuation of $295. This downturn coincides with a comprehensive cryptocurrency market correction intensified by escalating geopolitical instability on February 28, 2026.
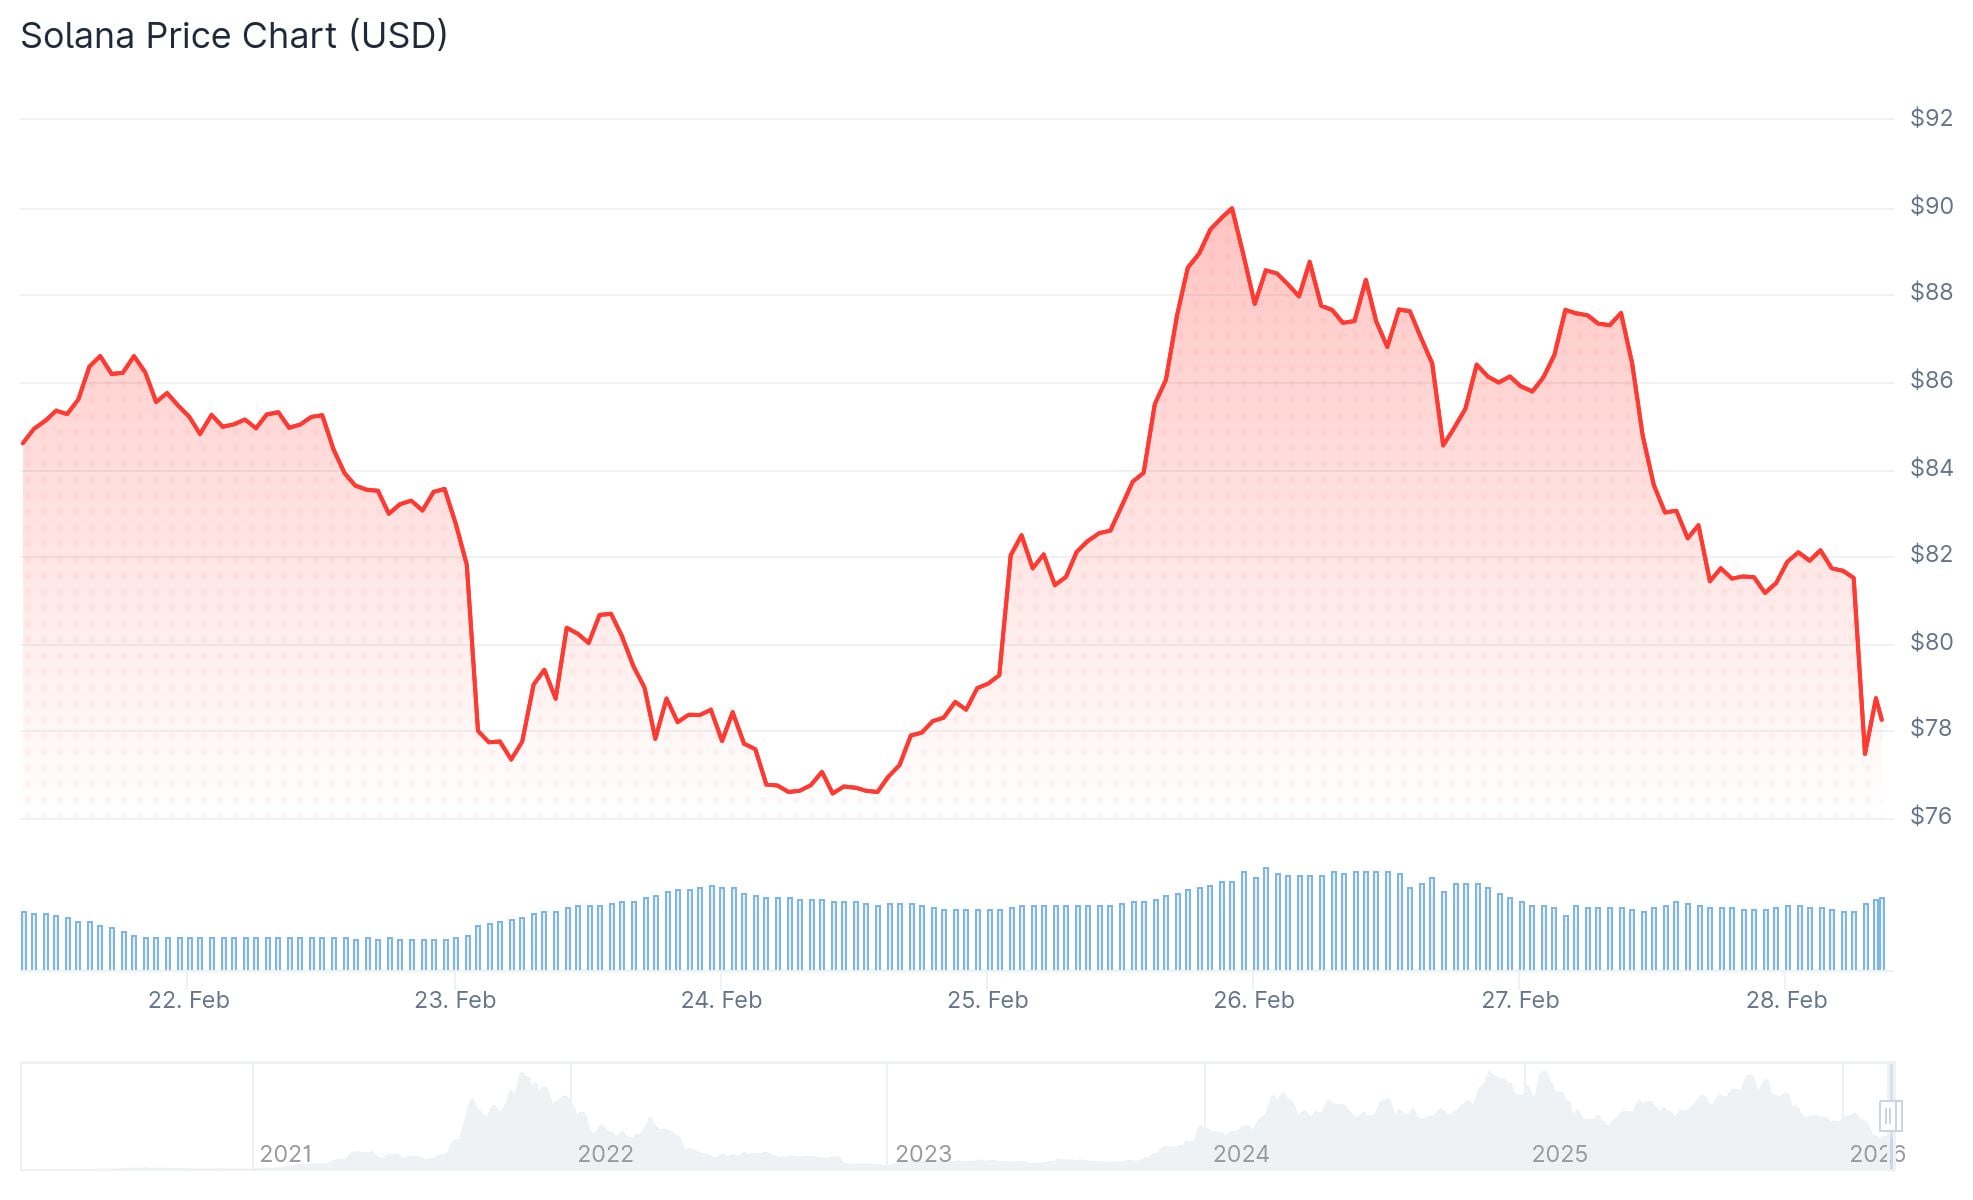 Solana (SOL) Price
Saturday morning witnessed Israeli forces conducting military operations against Iranian targets. Intelligence from AP sources confirms American involvement in the coordinated assault. Bitcoin experienced a sharp 5% correction within minutes, approaching the $60,000 threshold, with the resulting market panic cascading into alternative cryptocurrencies like SOL.
While price action reflects bearish sentiment, Solana’s fundamental network metrics demonstrate continued robustness. The blockchain recorded $108 billion in decentralized exchange volume throughout the previous 30-day period, outpacing Ethereum’s $63.7 billion and Base’s $31.48 billion by significant margins.
During the past 24-hour cycle, Solana applications produced $3.1 million in protocol revenue compared to Ethereum’s $2.95 million. The network maintained 2.17 million active wallet addresses, substantially exceeding Ethereum’s 682,236 active participants.
Solana’s real-world asset tokenization ecosystem has achieved a new milestone valuation of $1.71 billion, marking a 45% increase over the past month.
SOL ETF Flows Hold Steady
Exchange-traded fund products for SOL debuted in late October 2025, attracting more than $100 million in average daily net inflows throughout their initial five-week period. Weekly capital inflows have subsequently moderated to the $20–$25 million range as token valuations contracted.
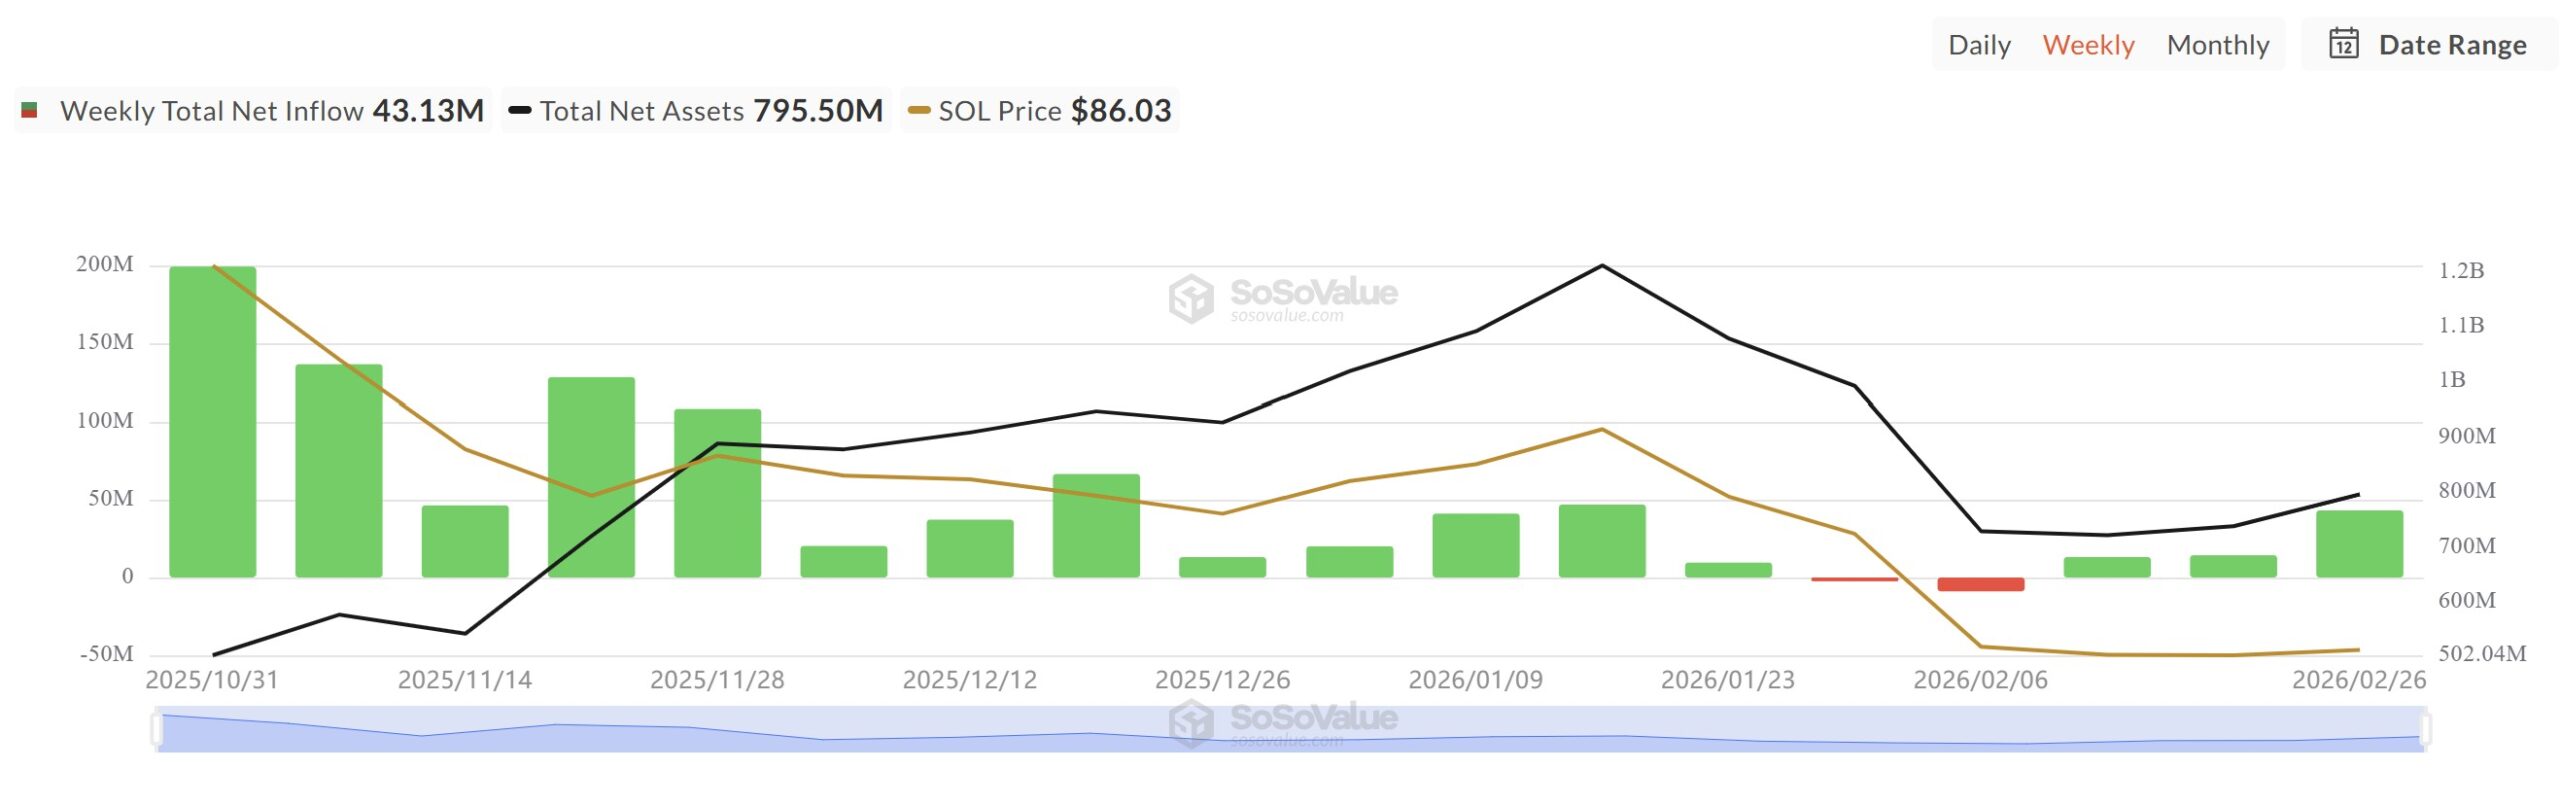 Source: SoSoValue
Total accumulated outflows throughout the four-month price correction measure merely $11.3 million across a two-week span. Comparatively, Bitcoin and Ethereum ETF products documented four consecutive months of net negative flows during this identical timeframe.
Solana is presently trading substantially beneath the $188 valuation observed during its ETF product introduction.
Key Support Levels to Watch
Market analyst Ali Martinez has identified a Parallel Channel formation developing on SOL’s weekly timeframe chart. This technical pattern suggests potential support zones positioned at $50.22, $22.47, and $9.98.
Analyst Crypto Scient has pinpointed two supplementary areas of interest. The initial zone corresponds to the 0.75 Fibonacci retracement level spanning $60 to $70. The secondary area represents a weekly demand fair value gap situated between $22 and $29.
UTXO analytics from Glassnode indicate that over 6% of circulating SOL supply last transacted within the current valuation range. The subsequent significant supply concentration, exceeding 3%, exists between $20 and $30.
SOL continues trading beneath the weekly resistance threshold of $120. The $51 to $80 range on weekly charts has undergone testing and corresponds with the retracement zone under analyst scrutiny.
As of February 28, 2026, SOL maintained a $78 valuation as cryptocurrency markets absorbed developments from the Israel-Iran military engagement.
The post Solana Price Analysis: SOL Slides 5% Amid Middle East Tensions – Critical Support Zones Ahead appeared first on Blockonomi.
You May Also Like

WELIREG® (belzutifan) Plus LENVIMA® (lenvatinib) Reduced the Risk of Disease Progression or Death by 30% Compared to Cabozantinib in Certain Previously Treated Patients With Advanced Renal Cell Carcinoma (RCC)

Why Bitcoin traders have to price tariffs like surprise rate hikes while waiting on social media posts for the next $175B trigger
