
Crypto Market Fear Analysis: When Sentiment Diverges from Price Action

Key Takeaways
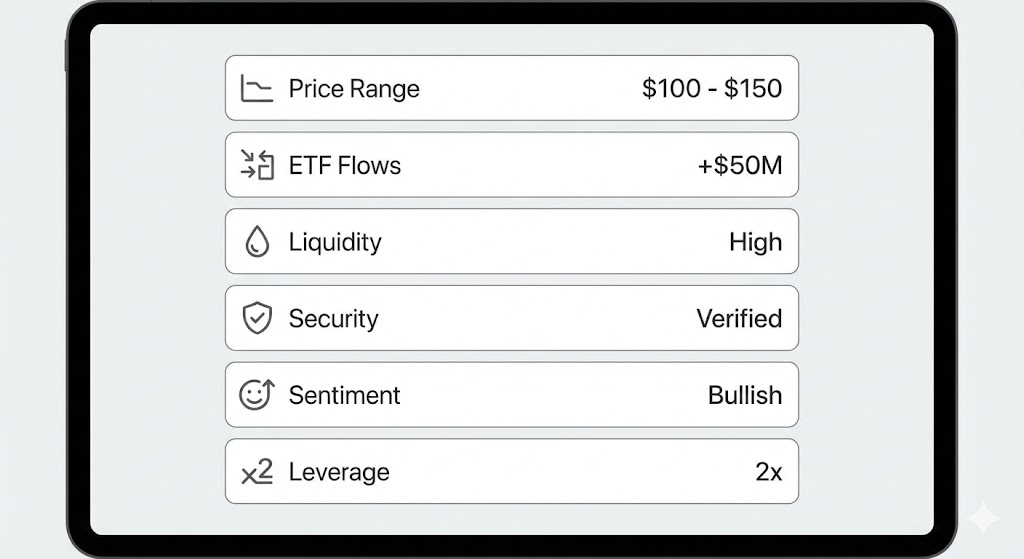
- The Disconnect: In late Dec 2025, sentiment hit "Extreme Fear" (20/100), yet BTC and ETH maintained their structural support, correcting only 3-5% from highs.
- Headline Fatigue: News about net outflows from Spot ETFs amplified bearish sentiment, overshadowing the resilience of spot prices.
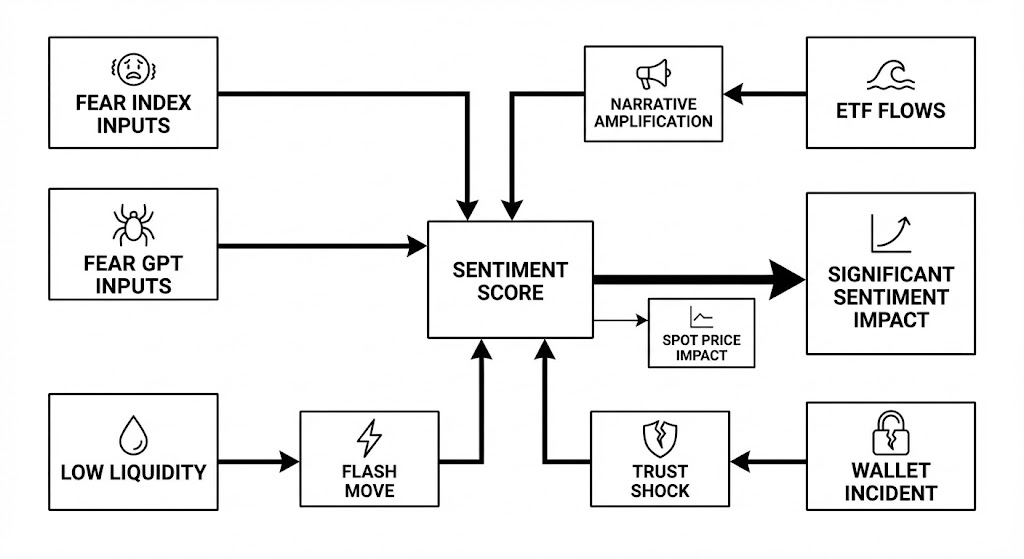
- Liquidity Factors: A flash move on an external trading venue and the Trust Wallet security incident created "micro-panic" during low-liquidity holiday hours.
- Lesson for 2026: Investors must distinguish between psychological stress (headlines) and structural stress (broken trends).
The Fear Gauge vs. Market Reality
- BTC Price Drawdown: Bitcoin traded roughly 3-4% below its weekly high.
- ETH Price Drawdown: Ethereum traded approximately 3-5% below its weekly high.
What Drove the Fear? (Dec 2025 Analysis)
1.The ETF Outflow Narrative
2.Isolated Flash Moves
- The Event: A quick wick down on a single pair that quickly rebounded.
- The Reality: This was a microstructure event isolated to one venue. However, screenshots of the "crash" circulated widely, manufacturing artificial fear.
3.The Trust Wallet Incident
FAQ: Applying These Lessons to 2026
Why did the Fear Index stay low if BTC didn't crash?
How should I react to ETF outflows this year?
Was the flash move a sign of a broken market?
Disclaimer:
Popular Articles
StableChain (STABLE) Market Insight: On-Chain Reality vs. Doubling Potential
Key TakeawaysInnovation: StableChain uses USDT as its native gas token, removing the need for volatile assets like ETH or SOL for transaction fees.Bearish Signal: Despite a high-profile launch in Dec
Can Stargate (STG) Regain Price Momentum Through veSTG Incentives in 2026?
As the cross-chain interoperability landscape matures in 2026, Stargate Finance (STG) finds itself at a structural crossroads following its acquisition by the LayerZero Foundation. For investors, the

Solana vs. Ethereum L2s: 2026 Fundamental Analysis (TVL, Revenue & Stablecoins)
Key Takeaways (Executive Summary)The Capital Split: DeFi TVL is neck-and-neck (Solana $9.2B vs. Major L2 Basket $9.05B), but Ethereum L2s dominate in broad secured assets ($40.5B TVS).The Revenue Flip
Dogecoin to the Moon: Decoding the Hype, Memes, and Market Reality
In the digital asset lexicon, few phrases carry as much cultural weight as "Dogecoin to the moon." What began as a playful rallying cry on Reddit and X has evolved into a psychological benchmark for s
Hot Crypto Updates
View More
Dogecoin (DOGE) Bullish Price Prediction
Introduction to Bullish DOGE Outlook Optimistic investors often look to bullish price predictions for Dogecoin (DOGE) to identify the coin's growth potential during favorable market cycles. A bullish

Zcash (ZEC) Bullish Price Prediction
Introduction to Bullish ZEC Outlook Optimistic investors often look to bullish price predictions for Zcash (ZEC) to identify the coin's growth potential during favorable market cycles. A bullish

Ripple (XRP) Bullish Price Prediction
Introduction to Bullish XRP Outlook Optimistic investors often look to bullish price predictions for Ripple (XRP) to identify the coin's growth potential during favorable market cycles. A bullish XRP

BNB (BNB) Bullish Price Prediction
Introduction to Bullish BNB Outlook Optimistic investors often look to bullish price predictions for BNB (BNB) to identify the coin's growth potential during favorable market cycles. A bullish
Trending News
View More
7 Best Polygon Wallets in 2026
The post 7 Best Polygon Wallets in 2026 appeared on BitcoinEthereumNews.com. Polygon is a popular choice among cryptocurrency users since it offers compatibility

Monero & Solana Projections Look Dull for 2026 – Experts Flag ZKP as the Top Trending Crypto for 5000x Gains
Explore why analysts are comparing Zero Knowledge Proof (ZKP) with Monero and Solana as rising demand reshapes entry prices in 2026.

Key Technology Trends for 2026: Strategic Technology Trends to Look Out for This Year
The technology landscape is moving faster than ever. By 2026, the pace of innovation will be defined by how well companies adapt, govern, and scale AI responsibly

What to Look for in a Modern AR-15 Pistol with Quick-Detach System
A modern AR-15 pistol with a quick-detach system offers flexibility, portability, and performance in a compact platform. Whether you are a recreational shooter
Related Articles
StableChain (STABLE) Market Insight: On-Chain Reality vs. Doubling Potential
Key TakeawaysInnovation: StableChain uses USDT as its native gas token, removing the need for volatile assets like ETH or SOL for transaction fees.Bearish Signal: Despite a high-profile launch in Dec
Solana vs. Ethereum L2s: 2026 Fundamental Analysis (TVL, Revenue & Stablecoins)
Key Takeaways (Executive Summary)The Capital Split: DeFi TVL is neck-and-neck (Solana $9.2B vs. Major L2 Basket $9.05B), but Ethereum L2s dominate in broad secured assets ($40.5B TVS).The Revenue Flip
Common Dogecoin Trading Mistakes Beginners Make and How to Avoid Them
Dogecoin (DOGE)is one of the most famous digital assets in crypto. Its meme identity, familiar branding, and constant online conversation can make DOGE feel "easy" to understand—sometimes easier than
Dogecoin ETF: Current Status and Future Prospects
Key Takeaways:TheREX-Osprey Dogecoin ETF (DOJE)launched in September 2025 as the first U.S. product offering DOGE exposure through a combination of holdings and derivatives.TheGrayscale Dogecoin Trust
