

The Difference Between Change and Range
1. What Are Price Change and Range?
1.1 What Is Price Change?
1.2 What Is Range?
1.3 How to Interpret Price Change and Range
2. The Importance of Price Change and Range
2.1 Market Trend Analysis
2.2 Risk Management
2.3 Trading Decisions
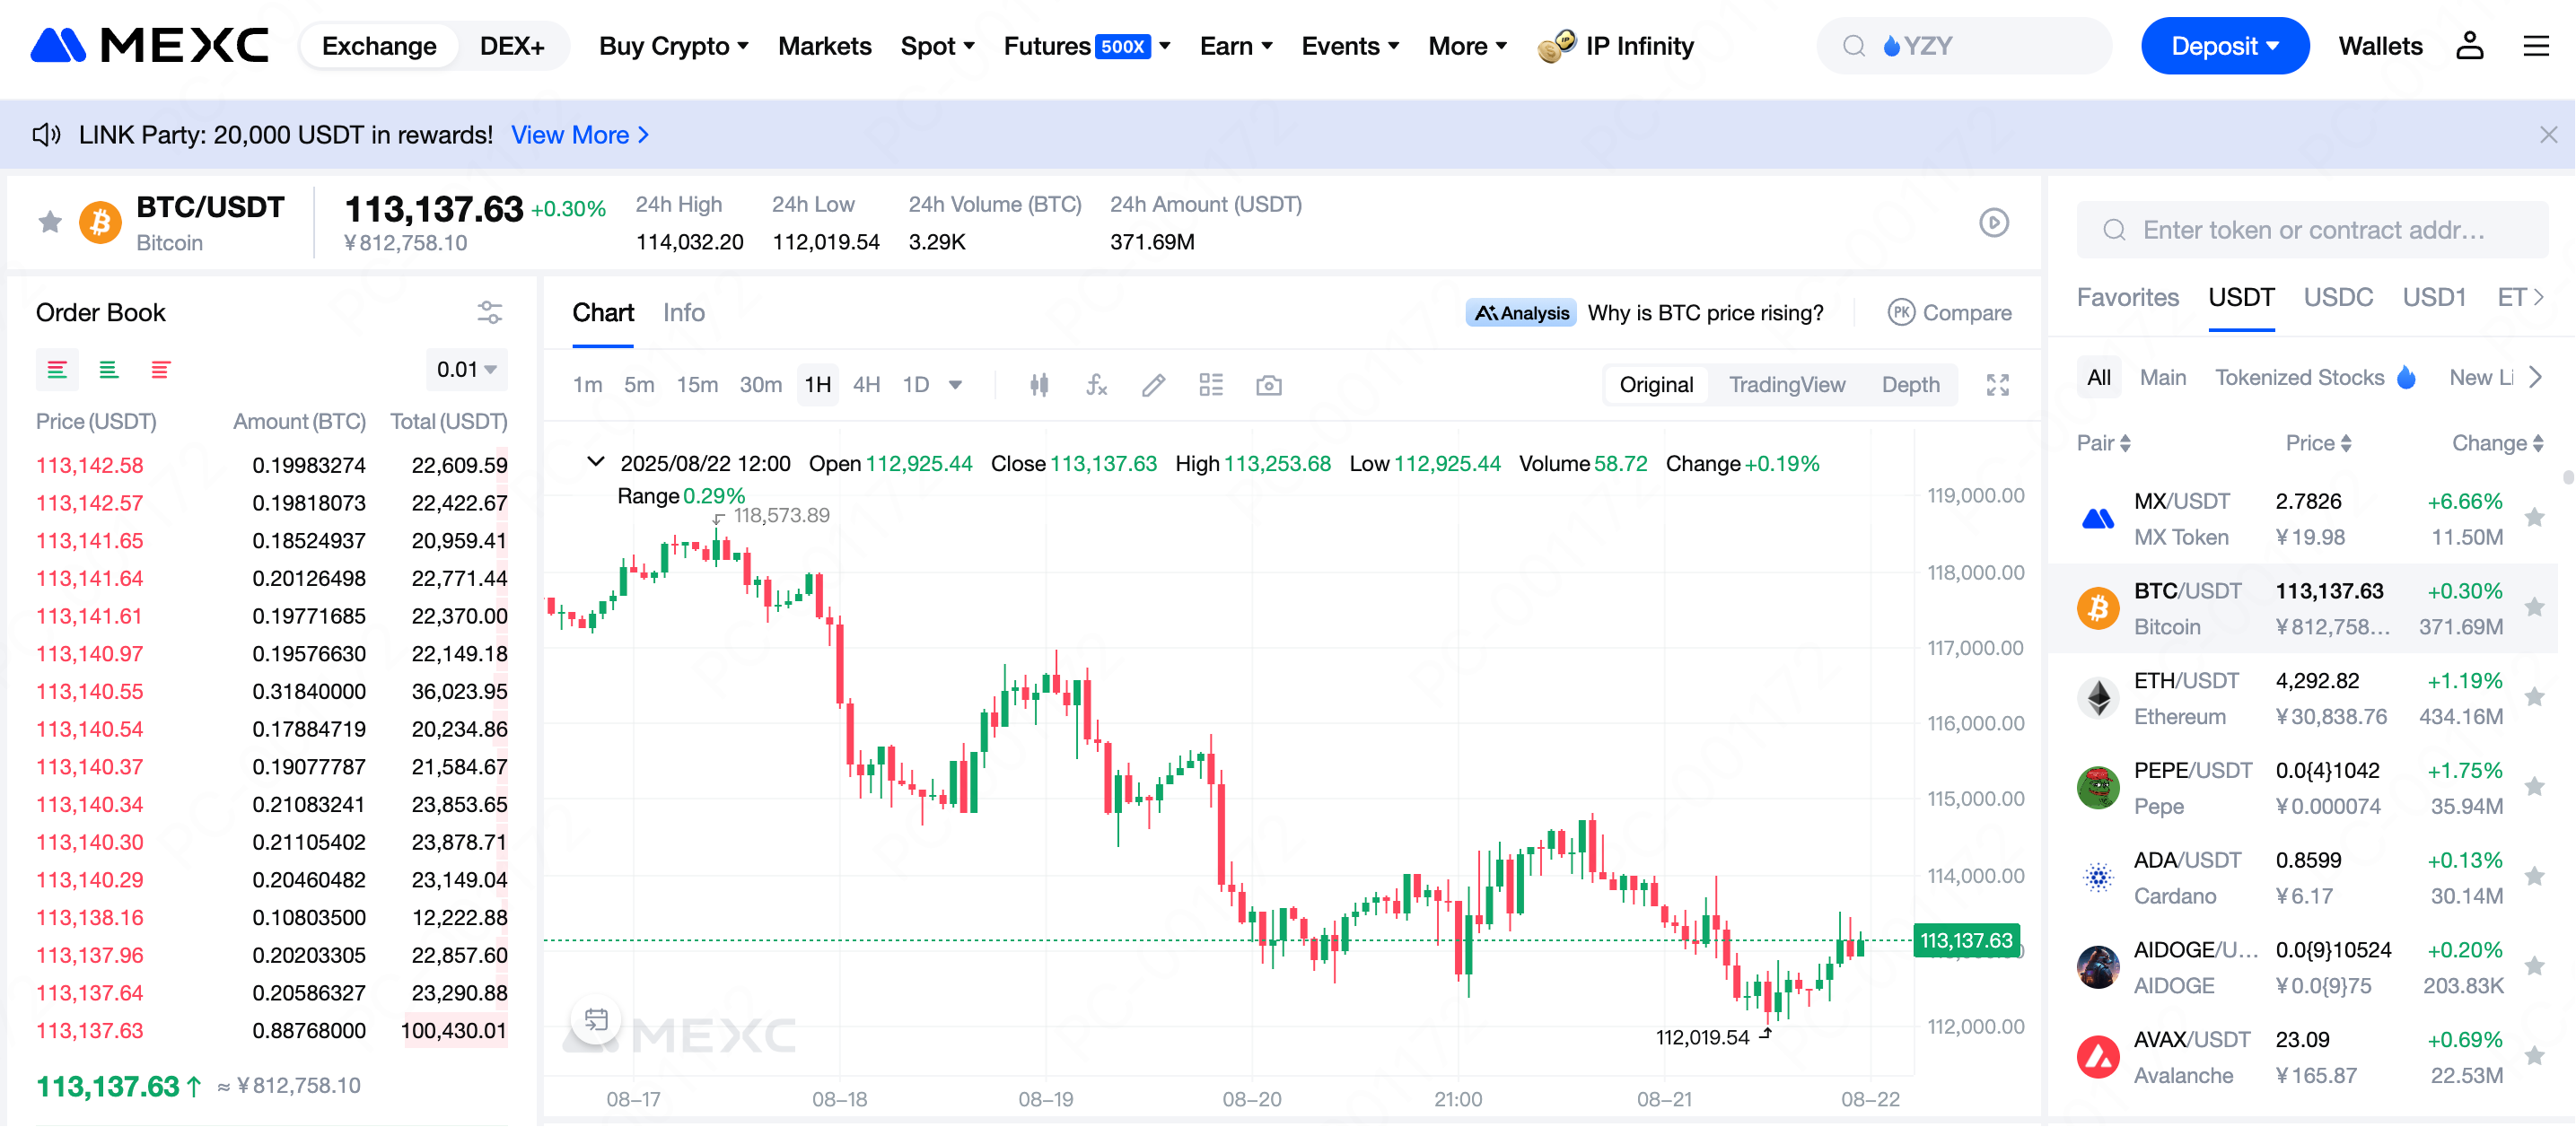
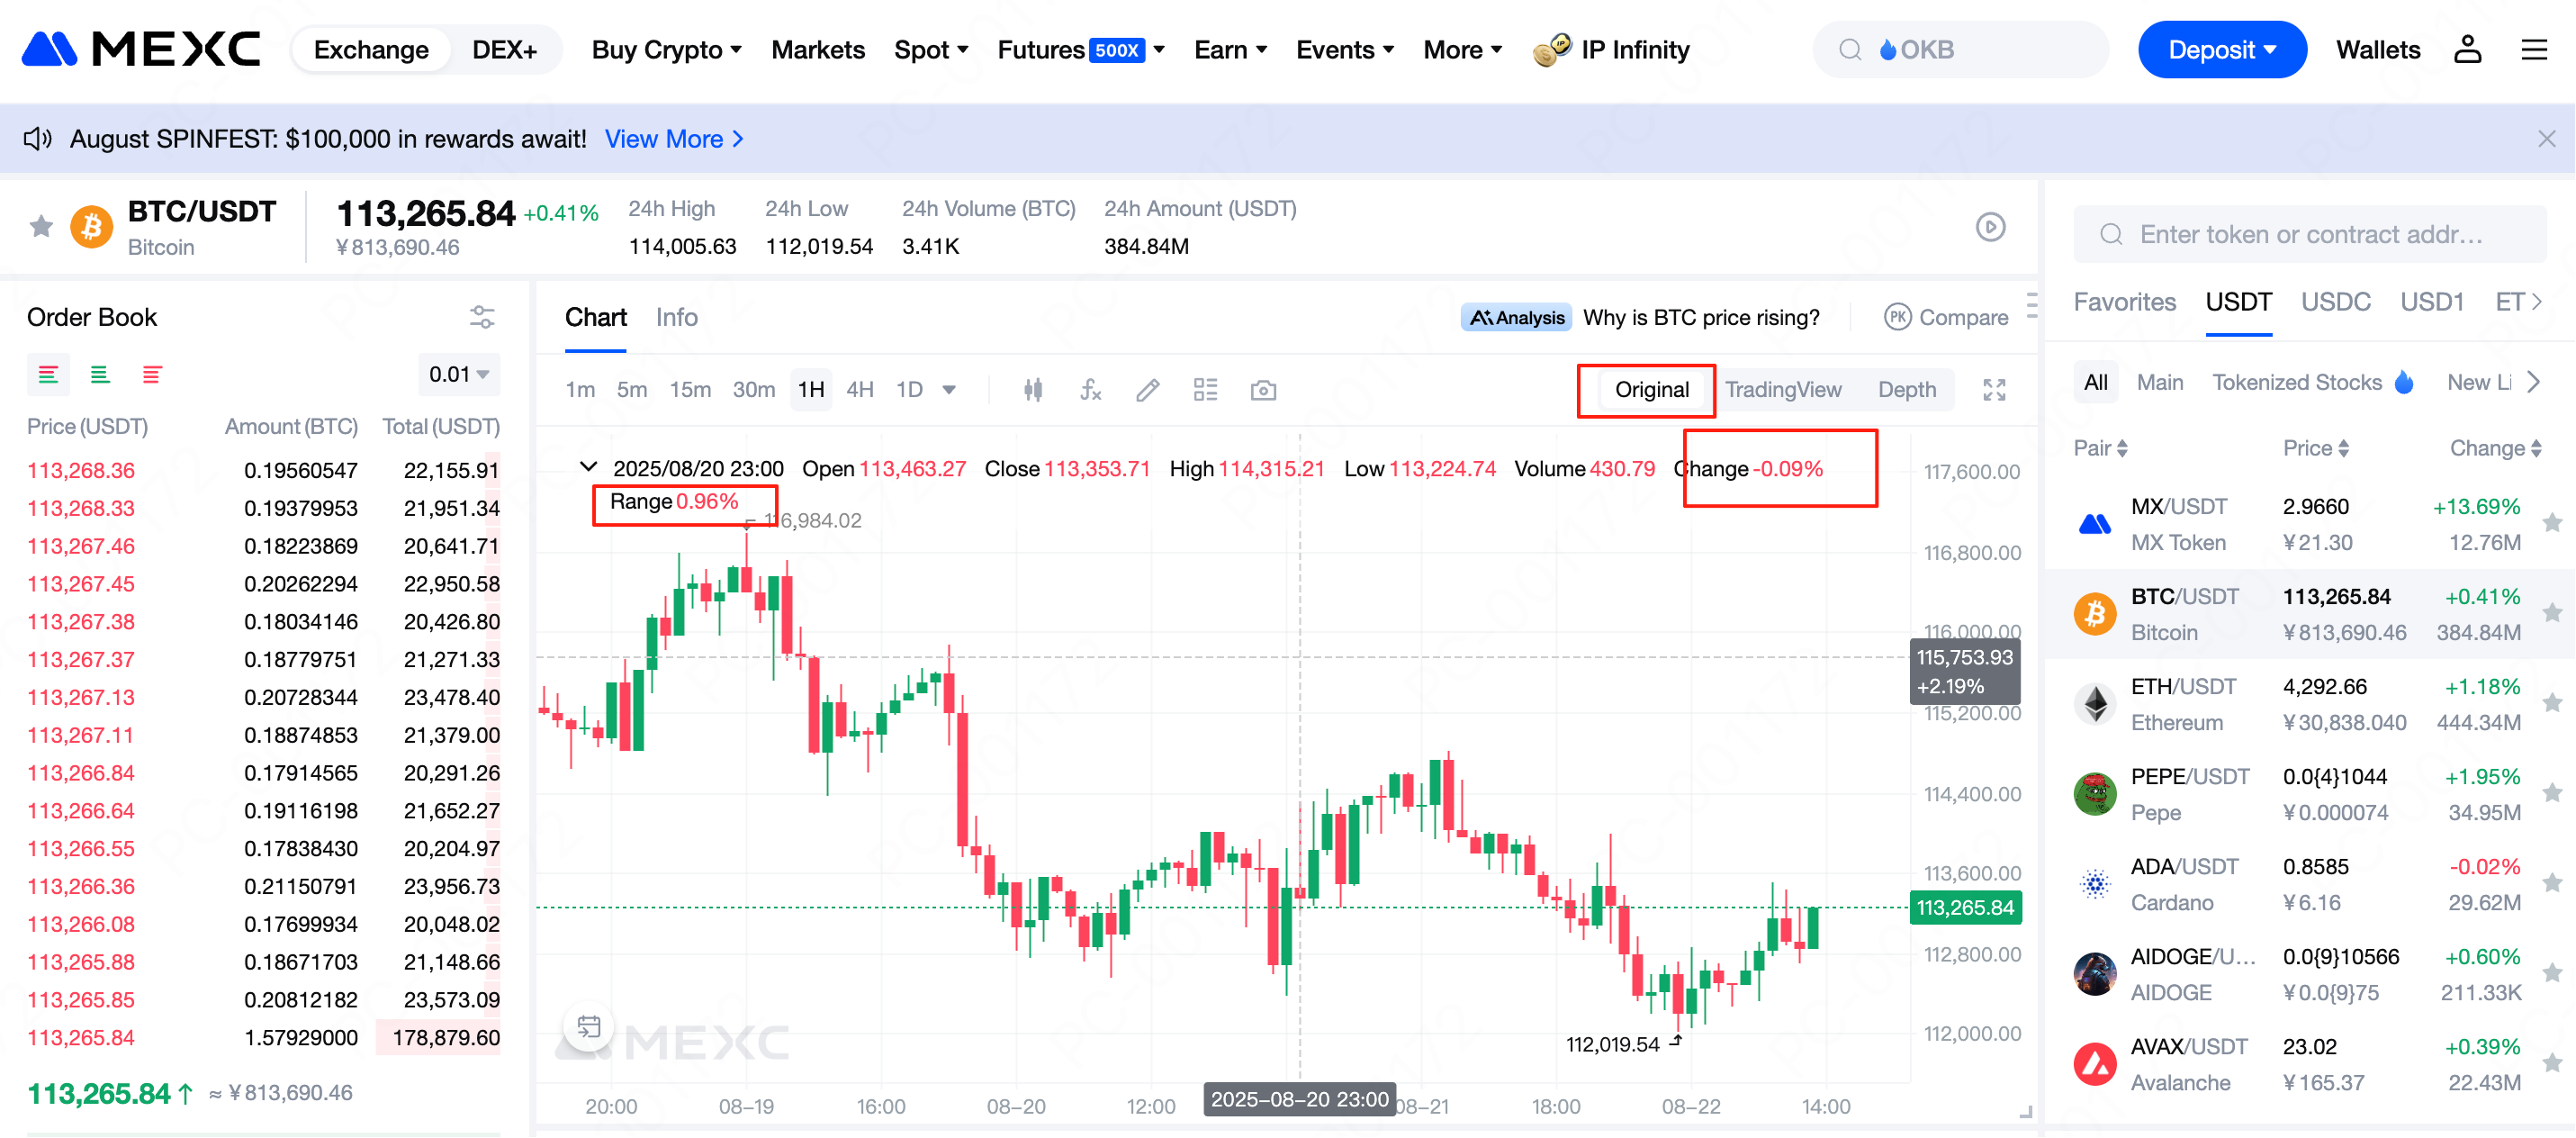
3. How to View Price Change and Range Data on MEXC
4. The Importance of Learning to Read Price Change and Range
5. Frequently Asked Questions (FAQs) for Beginners
- Price change helps identify the market trend.
- Range helps assess the level of market risk.
6. Conclusion
Recommended Reading:
- Why Choose MEXC Futures? Gain deeper insight into the advantages and unique features of MEXC Futures to help you stay ahead in the market.
- MEXC Futures Trading Tutorial (App) Understand the full process of trading Futures on the app and get started with ease.
Popular Articles
How Does Tokenized Gold Work? The 2026 Guide to the RWA Infrastructure
In the 2026 financial ecosystem, gold has evolved from a static metal into a dynamic, programmable digital tool. As global markets seek transparency and 24/7 liquidity, the mechanism behind digital pr

USDC Contract Address: Official Addresses for Every Blockchain
This guide covers everything you need to know about USDC contract addresses across every major blockchain — from Ethereum and Solana to Polygon, Arbitrum, and beyond.Whether you're adding USDC to Meta

How to Buy USDC? Step-by-Step Guide to Purchasing USD Coin
Finding a secure way to buy USDC doesn't have to be complicated. This guide walks you through everything you need to know about purchasing USD Coin, from understanding what makes this stablecoin relia
USDC Stablecoin Overview: Your Guide to Circle's USD Coin
Cryptocurrency prices can swing wildly in minutes, making them impractical for everyday transactions. USDC stablecoin solves this problem by maintaining a steady $1 value, backed by real dollar reserv
Hot Crypto Updates
View More
Aster (ASTER) 7-Day Price Change: Latest Price Performance and Analysis
The Latest Aster (ASTER) price has shown significant movement over the past week. In this article, we'll examine the current Aster price, ASTER 7-day performance, and the market factors shaping the

Ripple (XRP) 7-day Price Change
The Latest Ripple (XRP) price has shown significant movement over the past week. In this article, we'll examine its current XRP price, 7-day performance, and the market factors shaping XRP's trend,

BNB (BNB) 7-day Price Change
The Latest BNB (BNB) price has shown significant movement over the past week. In this article, we'll examine its current BNB price, 7-day performance, and the market factors shaping BNB's trend. BNB

Cardano (ADA) 7-day Price Change
The Latest Cardano (ADA) price has shown significant movement over the past week. In this article, we'll examine its current price, 7-day performance, and the market factors shaping ADA's trend.[7]
Trending News
View More
Certified Functional Behavior Assessment Programs Support Positive Behavior Change & Early Intervention
Functional assessments play a critical role in identifying the underlying causes of behaviors, performance challenges, and skill deficits across educational, clinical

NZD/USD rises as US Dollar dips, RBNZ growth outlook supports gains
The post NZD/USD rises as US Dollar dips, RBNZ growth outlook supports gains appeared on BitcoinEthereumNews.com. NZD/USD trades around 0.6000 on Friday at the

AI Workloads Are Reshaping Data Center Design
AI is pushing racks hotter and denser. See how power, cooling, layout, and monitoring must change to keep performance steady and scaling manageable.
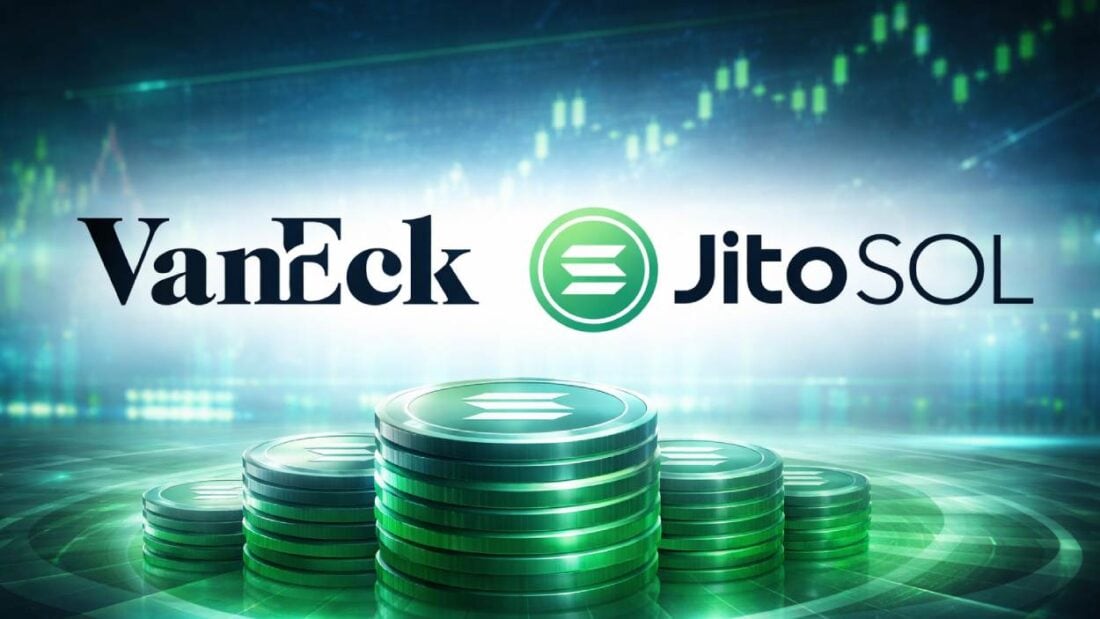
Nasdaq Pushes for First US JitoSOL Liquid Staking ETF Listing
Nasdaq has filed with the US Securities and Exchange Commission to list the VanEck JitoSOL ETF, a proposed fund that would directly hold the Solana based liquid
Related Articles
Spot Trading vs. Futures Trading: A Beginner's Guide to Determining Which is Right for You
As the cryptocurrency market continues to mature, the diversification of trading tools has become a key factor in building robust investment strategies. Among global mainstream crypto exchanges, MEXC

What is Spot Trading in Crypto? Complete MEXC Guide for Beginners
Cryptocurrency trading is typically divided into two categories: spot trading and futures trading. Spot trading is the act of buying or selling digital assets on the market, referring to the exchange

MEXC Pre-Market Trading Guide: How to Trade Tokens Before Listing & FAQ
1. What Is Pre-Market Trading?Pre-Market Trading is an over-the-counter (OTC) service offered by MEXC. It gives traders the opportunity to buy and sell new tokens before they are officially listed on

MEXC Spot Trading Fees: Maker & Taker Rates Calculator
Key Takeaways MEXC charges 0% maker fees and 0.05% taker fees for spot trading, making it highly cost-effective for liquidity providers. MX token holders with 500+ tokens for 24 hours receive a 50
