Solana (SOL) Price Eyes Critical $88 Resistance After 6% Surge — What’s Next?
Key Takeaways
- Solana climbed beyond the $82 and $85 thresholds following a bullish flag pattern breakout on shorter timeframes.
- The token peaked at $87.04 before retracing and stabilizing around the mid-$80 range.
- Bulls are now targeting the $87.20 to $88 resistance zone as the next critical barrier.
- Key support levels are positioned at $83.75, $82.70, and $80 should downward pressure emerge.
- Technical indicators display conflicting signals, with near-term bullishness tempered by overbought readings on longer timeframes.
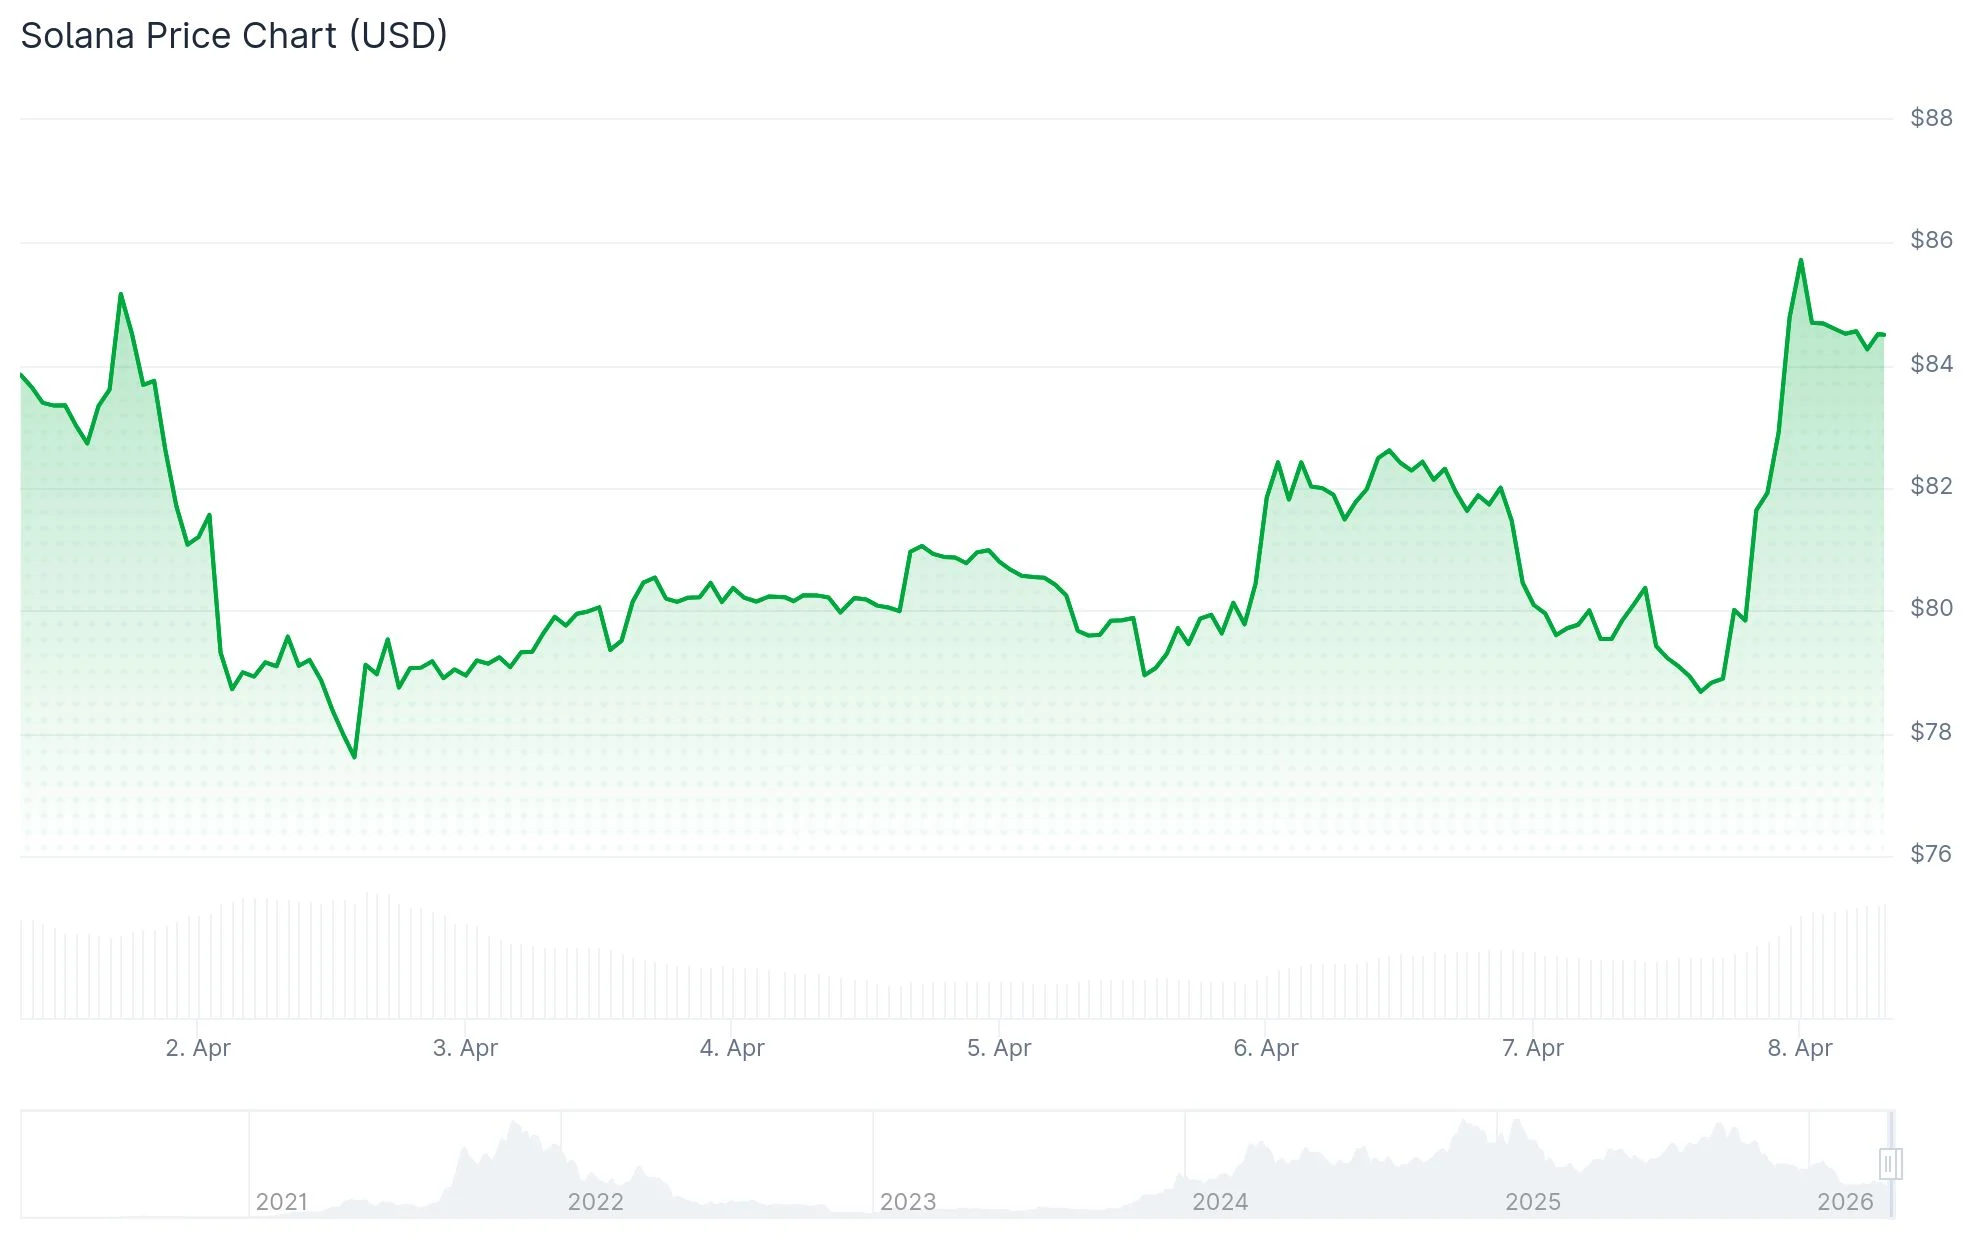
Solana (SOL) experienced notable upward momentum on April 8, with the cryptocurrency breaking through both the $82 and $85 price points. This advance has repositioned SOL into a constructive short-term technical framework.
 Solana (SOL) Price
The asset touched an intraday high of $87.04 before experiencing modest profit-taking. SOL subsequently stabilized between $84 and $85, retaining the majority of its daily gains.
Technical analysis of the hourly timeframe reveals that SOL successfully pierced through a bullish flag formation that had established resistance near the $80 mark. This technical breakout catalyzed the current upward trajectory.
The token is now positioned above its 100-hour simple moving average, a development that maintains bullish attention on upcoming resistance zones.
The immediate obstacle lies around $85, with the more significant resistance cluster concentrated near $88.
Should momentum carry SOL beyond $88, subsequent resistance targets emerge at $95 and $102. Extended strength could potentially drive the token toward the $112 level.
Recent gains encounter key technical barriers
Market data indicated SOL posted a 5.85% daily advance, bringing the price to approximately $84.18. This positioning leaves the token trading marginally below both its 20-day and 50-day moving averages.
The 200-day moving average remains substantially elevated at $134.10. Meanwhile, the Ichimoku Kijun indicator near $87.19 represents the most immediate technical resistance.
This configuration reinforces the significance of the $87.20 to $88 zone. Currently, SOL continues its attempt to penetrate this critical range.
Momentum indicators present a nuanced picture. While the RSI suggests modest bullish bias, both Stoch RSI and BBP readings indicate overbought territory following the recent price surge.
Analysis suggests a probable near-term trading range between $83.50 and $86.50 unless a decisive breakout occurs. This assessment aligns with the current post-rally consolidation pattern.
Downside support zones identified
If Solana encounters resistance at $88 and reverses, initial support emerges around $83.75.
The subsequent significant support level sits near $82.70, which corresponds to the 50% Fibonacci retracement of the rally from $78.38 to $87.04. Beneath that threshold, market participants are monitoring the $80 level closely.
A decisive close below $80 could expose the $75 region, signaling a reversal of the recent short-term bullish momentum.
Ali Charts noted that Solana continues trading within a broader consolidation channel, bounded by resistance at $96.04 and support at $76.66. According to his analysis, the coming 48 hours could prove decisive for April’s trajectory, with sustained support potentially enabling a bounce toward $81 and $85, while a breach below $76.66 might trigger further weakness toward $68.54.
Additional context includes recent security initiatives from the Solana Foundation and evolving regulatory developments in the United States. However, the immediate technical picture remains focused on price action: SOL rallied to $87.04 and is now determining whether sufficient buying pressure exists to overcome the $87.20 to $88 resistance cluster.
The post Solana (SOL) Price Eyes Critical $88 Resistance After 6% Surge — What’s Next? appeared first on Blockonomi.


You May Also Like

Tesla (TSLA) Stock Surges 4.4% Pre-Market on Iran Cease-Fire News

Six Swiss Banks Launch CHF Stablecoin Sandbox: UBS, PostFinance, Sygnum, and More