Ostium Research’s latest weekly note opened with Bitcoin under pressure after a swift selloff into the new week, describing “a mass liquidation event” that pushed price as low as $111,761, after rejection near resistance in the mid-$117,000s. The team frames the drawdown as part of a previously flagged “window of weakness… into early October,” while stressing the higher-timeframe uptrend remains intact unless key weekly levels fail. The report, published September 22, 2025, sets out both the technical map and the event calendar that could govern path-dependency over the next several sessions. Bitcoin Crash To $99,000 Looms On the weekly chart, Ostium notes last week’s consolidation around the August open and a wick into “key resistance… at $117.5k,” followed by a close marginally below the open. Early-week price action then carried price beneath reclaimed support into the $111k handle, with the analysts highlighting “over $1.6bn in longs liquidated so far today.” Two structural inflection zones anchor the bearish risk: “Acceptance below $107k on a weekly close would open up more downside into $99k,” whereas on the topside “the weekly high at $115.3k… is at least revisited some time later in the week.” Related Reading: Bitcoin Fear & Greed Index Signals ‘Fear’ As Price Falls To $112,000 On the daily timeframe, the August open at $115.7k is the pivot the market must reclaim to reassert momentum. As the authors put it, “that August open at $115.7k [is] a key level to flip into support to resume bullishness.” The immediate battleground is the prior all-time high at $112k, where “a reclaim of $112k as support” would tilt probabilities toward a higher low and force shorts to cover into a move back through $115.7k. Their base case, however, is for additional chop “between $112k-$115k before a second push lower below today’s low,” which will determine whether the market undercuts the June swing at $107k or marks out a bottom sooner. Tactically, Ostium lays out both long and short triggers with unusual clarity. On the long side: “a sweep of today’s low early this week and then a reclaim of $112k as support,” riding momentum “back into the weekly high.” On the short side, they float what they call “a really nice short setup… a sharp v-reversal… back above the weekly high… before… rejecting and breaking back below $115.3k,” which would then target “$112k and lower.” In other words, a squeeze-then-fade path that punishes both late longs and late shorts. Related Reading: Bitcoin Stuck In Neutral While Markets Roar — Analyst Explains Why Positioning and derivatives breadth round out the near-term blueprint. The note shares snapshots of 3-month annualized basis, Bitcoin versus altcoin open interest, and one-week/one-month liquidation maps, underscoring how quickly liquidity pockets can flip into magnets in thin conditions. This informs their near-term expectation that “the next leg lower or second liquidation event this week [could] be a high probability low,” followed by a retest of $115.3k that will act as the tape’s verdict on whether another down-leg or a bear-trap reversal is in play into quarter-end. The house view remains probabilistic rather than doctrinaire. If $107k fails on a weekly close, the weakness window could extend into “$99k”; if it holds—and especially if the market can “flip $115.7k into support”—the higher-low narrative stays alive. In the authors’ words, for Ethereum “nothing about this higher timeframe structure or momentum is currently giga-bearish,” and, by analogy, Bitcoin’s structure is best judged by the reaction around $111.7k–$112k this week. Whether today’s flush proves to be prelude to capitulation or the trap before new highs, Ostium’s bottom line is clear: “we move much higher from early October” unless those weekly thresholds are accepted lower. At press time, BTC traded at $113,002. Featured image created with DALL.E, chart from TradingView.comOstium Research’s latest weekly note opened with Bitcoin under pressure after a swift selloff into the new week, describing “a mass liquidation event” that pushed price as low as $111,761, after rejection near resistance in the mid-$117,000s. The team frames the drawdown as part of a previously flagged “window of weakness… into early October,” while stressing the higher-timeframe uptrend remains intact unless key weekly levels fail. The report, published September 22, 2025, sets out both the technical map and the event calendar that could govern path-dependency over the next several sessions. Bitcoin Crash To $99,000 Looms On the weekly chart, Ostium notes last week’s consolidation around the August open and a wick into “key resistance… at $117.5k,” followed by a close marginally below the open. Early-week price action then carried price beneath reclaimed support into the $111k handle, with the analysts highlighting “over $1.6bn in longs liquidated so far today.” Two structural inflection zones anchor the bearish risk: “Acceptance below $107k on a weekly close would open up more downside into $99k,” whereas on the topside “the weekly high at $115.3k… is at least revisited some time later in the week.” Related Reading: Bitcoin Fear & Greed Index Signals ‘Fear’ As Price Falls To $112,000 On the daily timeframe, the August open at $115.7k is the pivot the market must reclaim to reassert momentum. As the authors put it, “that August open at $115.7k [is] a key level to flip into support to resume bullishness.” The immediate battleground is the prior all-time high at $112k, where “a reclaim of $112k as support” would tilt probabilities toward a higher low and force shorts to cover into a move back through $115.7k. Their base case, however, is for additional chop “between $112k-$115k before a second push lower below today’s low,” which will determine whether the market undercuts the June swing at $107k or marks out a bottom sooner. Tactically, Ostium lays out both long and short triggers with unusual clarity. On the long side: “a sweep of today’s low early this week and then a reclaim of $112k as support,” riding momentum “back into the weekly high.” On the short side, they float what they call “a really nice short setup… a sharp v-reversal… back above the weekly high… before… rejecting and breaking back below $115.3k,” which would then target “$112k and lower.” In other words, a squeeze-then-fade path that punishes both late longs and late shorts. Related Reading: Bitcoin Stuck In Neutral While Markets Roar — Analyst Explains Why Positioning and derivatives breadth round out the near-term blueprint. The note shares snapshots of 3-month annualized basis, Bitcoin versus altcoin open interest, and one-week/one-month liquidation maps, underscoring how quickly liquidity pockets can flip into magnets in thin conditions. This informs their near-term expectation that “the next leg lower or second liquidation event this week [could] be a high probability low,” followed by a retest of $115.3k that will act as the tape’s verdict on whether another down-leg or a bear-trap reversal is in play into quarter-end. The house view remains probabilistic rather than doctrinaire. If $107k fails on a weekly close, the weakness window could extend into “$99k”; if it holds—and especially if the market can “flip $115.7k into support”—the higher-low narrative stays alive. In the authors’ words, for Ethereum “nothing about this higher timeframe structure or momentum is currently giga-bearish,” and, by analogy, Bitcoin’s structure is best judged by the reaction around $111.7k–$112k this week. Whether today’s flush proves to be prelude to capitulation or the trap before new highs, Ostium’s bottom line is clear: “we move much higher from early October” unless those weekly thresholds are accepted lower. At press time, BTC traded at $113,002. Featured image created with DALL.E, chart from TradingView.com

Bitcoin Price Could Still Crash To $99,000 If This Happens, Warns Ostium Labs

2025/09/23 19:30

Ostium Research’s latest weekly note opened with Bitcoin under pressure after a swift selloff into the new week, describing “a mass liquidation event” that pushed price as low as $111,761, after rejection near resistance in the mid-$117,000s.

The team frames the drawdown as part of a previously flagged “window of weakness… into early October,” while stressing the higher-timeframe uptrend remains intact unless key weekly levels fail. The report, published September 22, 2025, sets out both the technical map and the event calendar that could govern path-dependency over the next several sessions.

Bitcoin Crash To $99,000 Looms

On the weekly chart, Ostium notes last week’s consolidation around the August open and a wick into “key resistance… at $117.5k,” followed by a close marginally below the open. Early-week price action then carried price beneath reclaimed support into the $111k handle, with the analysts highlighting “over $1.6bn in longs liquidated so far today.”
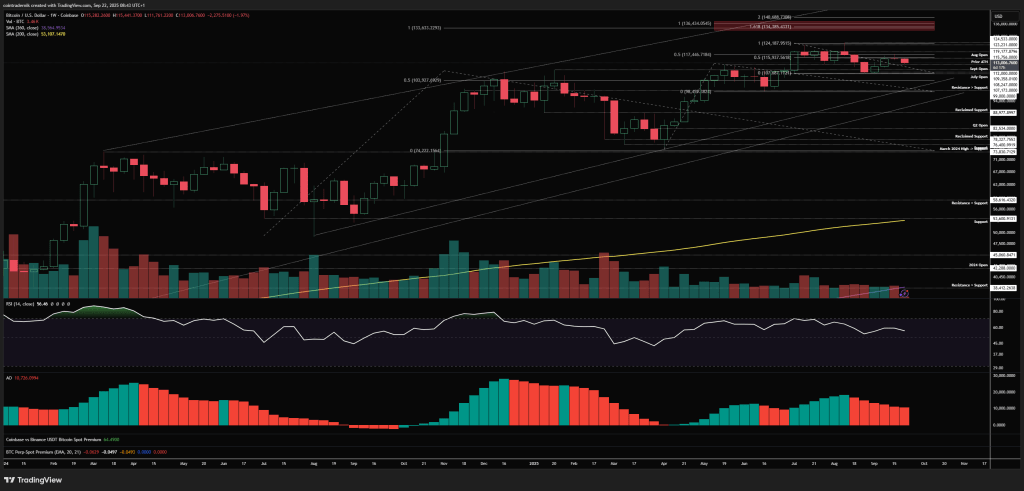
Bitcoin weekly chart

Two structural inflection zones anchor the bearish risk: “Acceptance below $107k on a weekly close would open up more downside into $99k,” whereas on the topside “the weekly high at $115.3k… is at least revisited some time later in the week.”

On the daily timeframe, the August open at $115.7k is the pivot the market must reclaim to reassert momentum. As the authors put it, “that August open at $115.7k [is] a key level to flip into support to resume bullishness.”

The immediate battleground is the prior all-time high at $112k, where “a reclaim of $112k as support” would tilt probabilities toward a higher low and force shorts to cover into a move back through $115.7k. Their base case, however, is for additional chop “between $112k-$115k before a second push lower below today’s low,” which will determine whether the market undercuts the June swing at $107k or marks out a bottom sooner.

Bitcoin daily chart

Tactically, Ostium lays out both long and short triggers with unusual clarity. On the long side: “a sweep of today’s low early this week and then a reclaim of $112k as support,” riding momentum “back into the weekly high.” On the short side, they float what they call “a really nice short setup… a sharp v-reversal… back above the weekly high… before… rejecting and breaking back below $115.3k,” which would then target “$112k and lower.” In other words, a squeeze-then-fade path that punishes both late longs and late shorts.

Positioning and derivatives breadth round out the near-term blueprint. The note shares snapshots of 3-month annualized basis, Bitcoin versus altcoin open interest, and one-week/one-month liquidation maps, underscoring how quickly liquidity pockets can flip into magnets in thin conditions.

This informs their near-term expectation that “the next leg lower or second liquidation event this week [could] be a high probability low,” followed by a retest of $115.3k that will act as the tape’s verdict on whether another down-leg or a bear-trap reversal is in play into quarter-end.

The house view remains probabilistic rather than doctrinaire. If $107k fails on a weekly close, the weakness window could extend into “$99k”; if it holds—and especially if the market can “flip $115.7k into support”—the higher-low narrative stays alive. In the authors’ words, for Ethereum “nothing about this higher timeframe structure or momentum is currently giga-bearish,” and, by analogy, Bitcoin’s structure is best judged by the reaction around $111.7k–$112k this week.

Whether today’s flush proves to be prelude to capitulation or the trap before new highs, Ostium’s bottom line is clear: “we move much higher from early October” unless those weekly thresholds are accepted lower.

At press time, BTC traded at $113,002.

Bitcoin price
Disclaimer: The articles reposted on this site are sourced from public platforms and are provided for informational purposes only. They do not necessarily reflect the views of MEXC. All rights remain with the original authors. If you believe any content infringes on third-party rights, please contact service@support.mexc.com for removal. MEXC makes no guarantees regarding the accuracy, completeness, or timeliness of the content and is not responsible for any actions taken based on the information provided. The content does not constitute financial, legal, or other professional advice, nor should it be considered a recommendation or endorsement by MEXC.

You May Also Like

What’s Happening In Crypto Today: BTC Retests $85k, ETH Consolidates Above $2.7k

What’s Happening In Crypto Today: BTC Retests $85k, ETH Consolidates Above $2.7k

The crypto landscape today is a bit of a mess. Established coins like Bitcoin (BTC) and Ethereum (ETH) are down and don’t seem to be able to stem the losses. In the last 24 hours, Bitcoin BTC $86,096.86 0.01% Bitcoin BTC Price $86,096.86 0.01% /24h Volume in 24h $35.96B Price 7d dropped to $83,540 before changing course and breaching the $84,000 level, and then finally retesting the $85,000 level, where it is trading at the moment. It is, however, still down by 11% on the weekly charts. Market Cap 24h 7d 30d 1y All Time For the most part, it seems like a weak job market, coupled with the dovish comments by New York Fed President John Williams, has encouraged buying at lower levels. $BTC break those two notable near term resistance marks, and we can see up to $93k… Mush bulls. pic.twitter.com/FmgW2ddn3i — Heisenberg (@Mr_Derivatives) November 23, 2025 Meanwhile, the Fed rate cut probability has jumped to more than 70% as opposed to nearly 40% just a few days ago, prompting traders to rotate into riskier assets such as crypto. (Source: FedWatch) However, a look at US BTC spot ETFs puts data into perspective. Per SoSoValue’s data, US BTC spot ETFs have lost more than $3 billion during the past month, with weekly outflows amounting to around $1.5 billion. The only bright side is that the daily inflow is still positive at $238 million, a drop in a bucket. (Source: SoSoValue) At the moment, BTC is trading below its 20-day and 50-day EMAs. For BTC to reverse its price action, it needs to recapture both these EMAs at $86,281 and $90,322 before it can retest its 100-day EMA at $95,075, which incidentally also forms the upper resistance level. (Source: TradingView) EXPLORE: Next 1000X Crypto – Here’s 10+ Crypto Tokens That Can Hit 1000x This Year ETH Crypto Consolidates Above $2.7k, Retests $2.8k Level Today Ethereum ETH $2,823.21 0.39% Ethereum ETH Price $2,823.21 0.39% /24h Volume in 24h $13.56B Price 7d has been experiencing difficulties over the past few days. For the longest time, it had managed to hold its own above the $3,100 level. Alas, it was not to be. Although ETH followed BTC during the broader market pullback, its decline was subdued and not as dramatic. Its price action took a decisive plunge and broke through the $3,000 support level before subsequently breaching more support zones, dropping to $2,680 before finally stabilizing above $2,700 level, where it had been consolidating since the last couple of days. Market Cap 24h 7d 30d 1y All Time For ETH to start ascending again, it must hold above $2,800. It is currently on its way to retest its 20-day EMA at $2,823. However, the critical level to capture is the 50-day EMA near $3,000, which is also the resistance level to beat. (Source: TradingView) Analysing on-chain data reveals heavy liquidation clusters surrounding its price action between $3,100 and $3,600, acting like major resistance zones. (Source: CoinGlass) At the same time, online sleuths think that now is a good time to get in on the action and buy the dip before the price flips again. Its Fusaka upgrade is slated for December, and with prices as low as they are, it might be good to go long. #ETH: Big potential. Buy the dip. Big upgrade coming (last one pumped price 50%). Correction is local, not expecting a big drop. $2600-$2700 possible bottom, otherwise trend breaks. Most weak hands are out. Good time to buy. Expecting new ATH, targeting $5K for profit taking. pic.twitter.com/zei8mEBCZu — Matt Wraith | AI & Dev (@MattWraithSOL) November 23, 2025 However, it all depends on ETH maintaining the $2,700 level. Sliding down from $2,700 will test lower support zones near $2,300-$2,400. EXPLORE: Top 20 Crypto to Buy in 2025 17 minutes ago Chainlink Core Infra For Tokenized Finance: Grayscale By Arijit Mukherjee Grayscale has chalked up Chainlink as indispensable for tokenized finance, arguing that its decentralized oracle network is unchallenged when it comes to connecting real-world data to blockchain systems.  According to Grayscale’s new research, with more and more traditional assets like stocks, bonds, and real estate moving to tokenization, reliable data feeds from Chainlink become even more important.  Grayscale research team members are suddenly retweeting @ChainLinkGod. Today they shared one of the best recent research papers on $LINK, basically calling it the best investment tied to the rise of tokenized finance. This is not random. The clock is currently running toward… pic.twitter.com/ZlpAEaI5dV — Moeskul (@Xmarine777) November 20, 2025 Chainlink has, over the years, slowly become a part of the plumbing for institutions such as SWIFT, DTCC, and ANZ Bank for proof‑of‑reserves, moving assets across chains, and automating settlements.  EXPLORE: The 12+ Hottest Crypto Presales to Buy Right Now  The post What’s Happening In Crypto Today: BTC Retests $85k, ETH Consolidates Above $2.7k appeared first on 99Bitcoins.
Share
Coinstats2025/11/23 12:01
Another Nasdaq-Listed Company Announces Massive Bitcoin (BTC) Purchase! Becomes 14th Largest Company! – They’ll Also Invest in Trump-Linked Altcoin!

Another Nasdaq-Listed Company Announces Massive Bitcoin (BTC) Purchase! Becomes 14th Largest Company! – They’ll Also Invest in Trump-Linked Altcoin!

The post Another Nasdaq-Listed Company Announces Massive Bitcoin (BTC) Purchase! Becomes 14th Largest Company! – They’ll Also Invest in Trump-Linked Altcoin! appeared on BitcoinEthereumNews.com. While the number of Bitcoin (BTC) treasury companies continues to increase day by day, another Nasdaq-listed company has announced its purchase of BTC. Accordingly, live broadcast and e-commerce company GD Culture Group announced a $787.5 million Bitcoin purchase agreement. According to the official statement, GD Culture Group announced that they have entered into an equity agreement to acquire assets worth $875 million, including 7,500 Bitcoins, from Pallas Capital Holding, a company registered in the British Virgin Islands. GD Culture will issue approximately 39.2 million shares of common stock in exchange for all of Pallas Capital’s assets, including $875.4 million worth of Bitcoin. GD Culture CEO Xiaojian Wang said the acquisition deal will directly support the company’s plan to build a strong and diversified crypto asset reserve while capitalizing on the growing institutional acceptance of Bitcoin as a reserve asset and store of value. With this acquisition, GD Culture is expected to become the 14th largest publicly traded Bitcoin holding company. The number of companies adopting Bitcoin treasury strategies has increased significantly, exceeding 190 by 2025. Immediately after the deal was announced, GD Culture shares fell 28.16% to $6.99, their biggest drop in a year. As you may also recall, GD Culture announced in May that it would create a cryptocurrency reserve. At this point, the company announced that they plan to invest in Bitcoin and President Donald Trump’s official meme coin, TRUMP token, through the issuance of up to $300 million in stock. *This is not investment advice. Follow our Telegram and Twitter account now for exclusive news, analytics and on-chain data! Source: https://en.bitcoinsistemi.com/another-nasdaq-listed-company-announces-massive-bitcoin-btc-purchase-becomes-14th-largest-company-theyll-also-invest-in-trump-linked-altcoin/
Share
BitcoinEthereumNews2025/09/18 04:06