

Bitcoin Stuck Below $90,000 — Key Metrics Must Shift for Breakout
Bitcoin Market Stalls Amid Low Participation and Tight Liquidity
Despite Bitcoin trading near $88,000, current market dynamics indicate a subdued environment characterized by declining on-chain activity and decreasing liquidity levels. These conditions suggest a period of consolidation, with limited prospects for a decisive move above $90,000 in the near term.
Key Takeaways
- Bitcoin’s network activity has diminished to its lowest levels in a year, despite the cryptocurrency’s stable price.
- Exchange inflows on major platforms like Binance and Coinbase have contracted sharply, indicating tighter market liquidity.
- Market participants are exercising caution, with long-term holders not rushing to sell and short-term traders refraining from aggressive accumulation.
- Technical analysis points to a range-bound Bitcoin, with key support and resistance zones highlighting potential liquidity targets for both bulls and bears.
Market Overview: Declining Network Activity and Liquidity
Recent data from CryptoQuant shows a significant slowdown in Bitcoin’s network activity. The 30-day moving average of active addresses has fallen to approximately 807,000—the lowest in the last year—signaling waning participation from retail investors and short-term traders. Moreover, exchange flow metrics reinforce this sentiment, with deposit and withdrawal activity on Binance reaching annual lows. The reduced exchange activity suggests a market in a state of equilibrium, where both accumulation and distribution pressure remain subdued.
Bitcoin active addresses decline. Source: CryptoQuantOn the liquidity front, inflow data from Coinbase and Binance illustrate how trading activity has contracted. On Nov. 24, when Bitcoin was trading near $88,500, inflows totaled $21 billion on Coinbase and $15.3 billion on Binance over a week. By December 21, despite the unchanged price level, inflows had fallen sharply—down 63% on Coinbase and more modestly on Binance—highlighting a drying up of new liquidity and indicating a cautious market stance.
Related: Are altcoins coming back? Why ‘Bitcoin season’ has staying power in 2026
Technical Levels Suggest a Narrow Trading Range
From a technical standpoint, Bitcoin remains confined within a range between $85,000 and $90,000. The price is currently below the monthly volume-weighted average price (VWAP), implying a cautious, neutral bias among traders. Key liquidity zones pinpoint two critical levels: on the downside, a buy-side fair-value gap between $85,800 and $86,500 contains dense long exposure, risking about $60 million in potential liquidations should price slip into this zone. Conversely, the resistance zone between $90,600 and $92,000 holds around $70 million in short liquidation risk, poised to be a barrier to further upward movement.
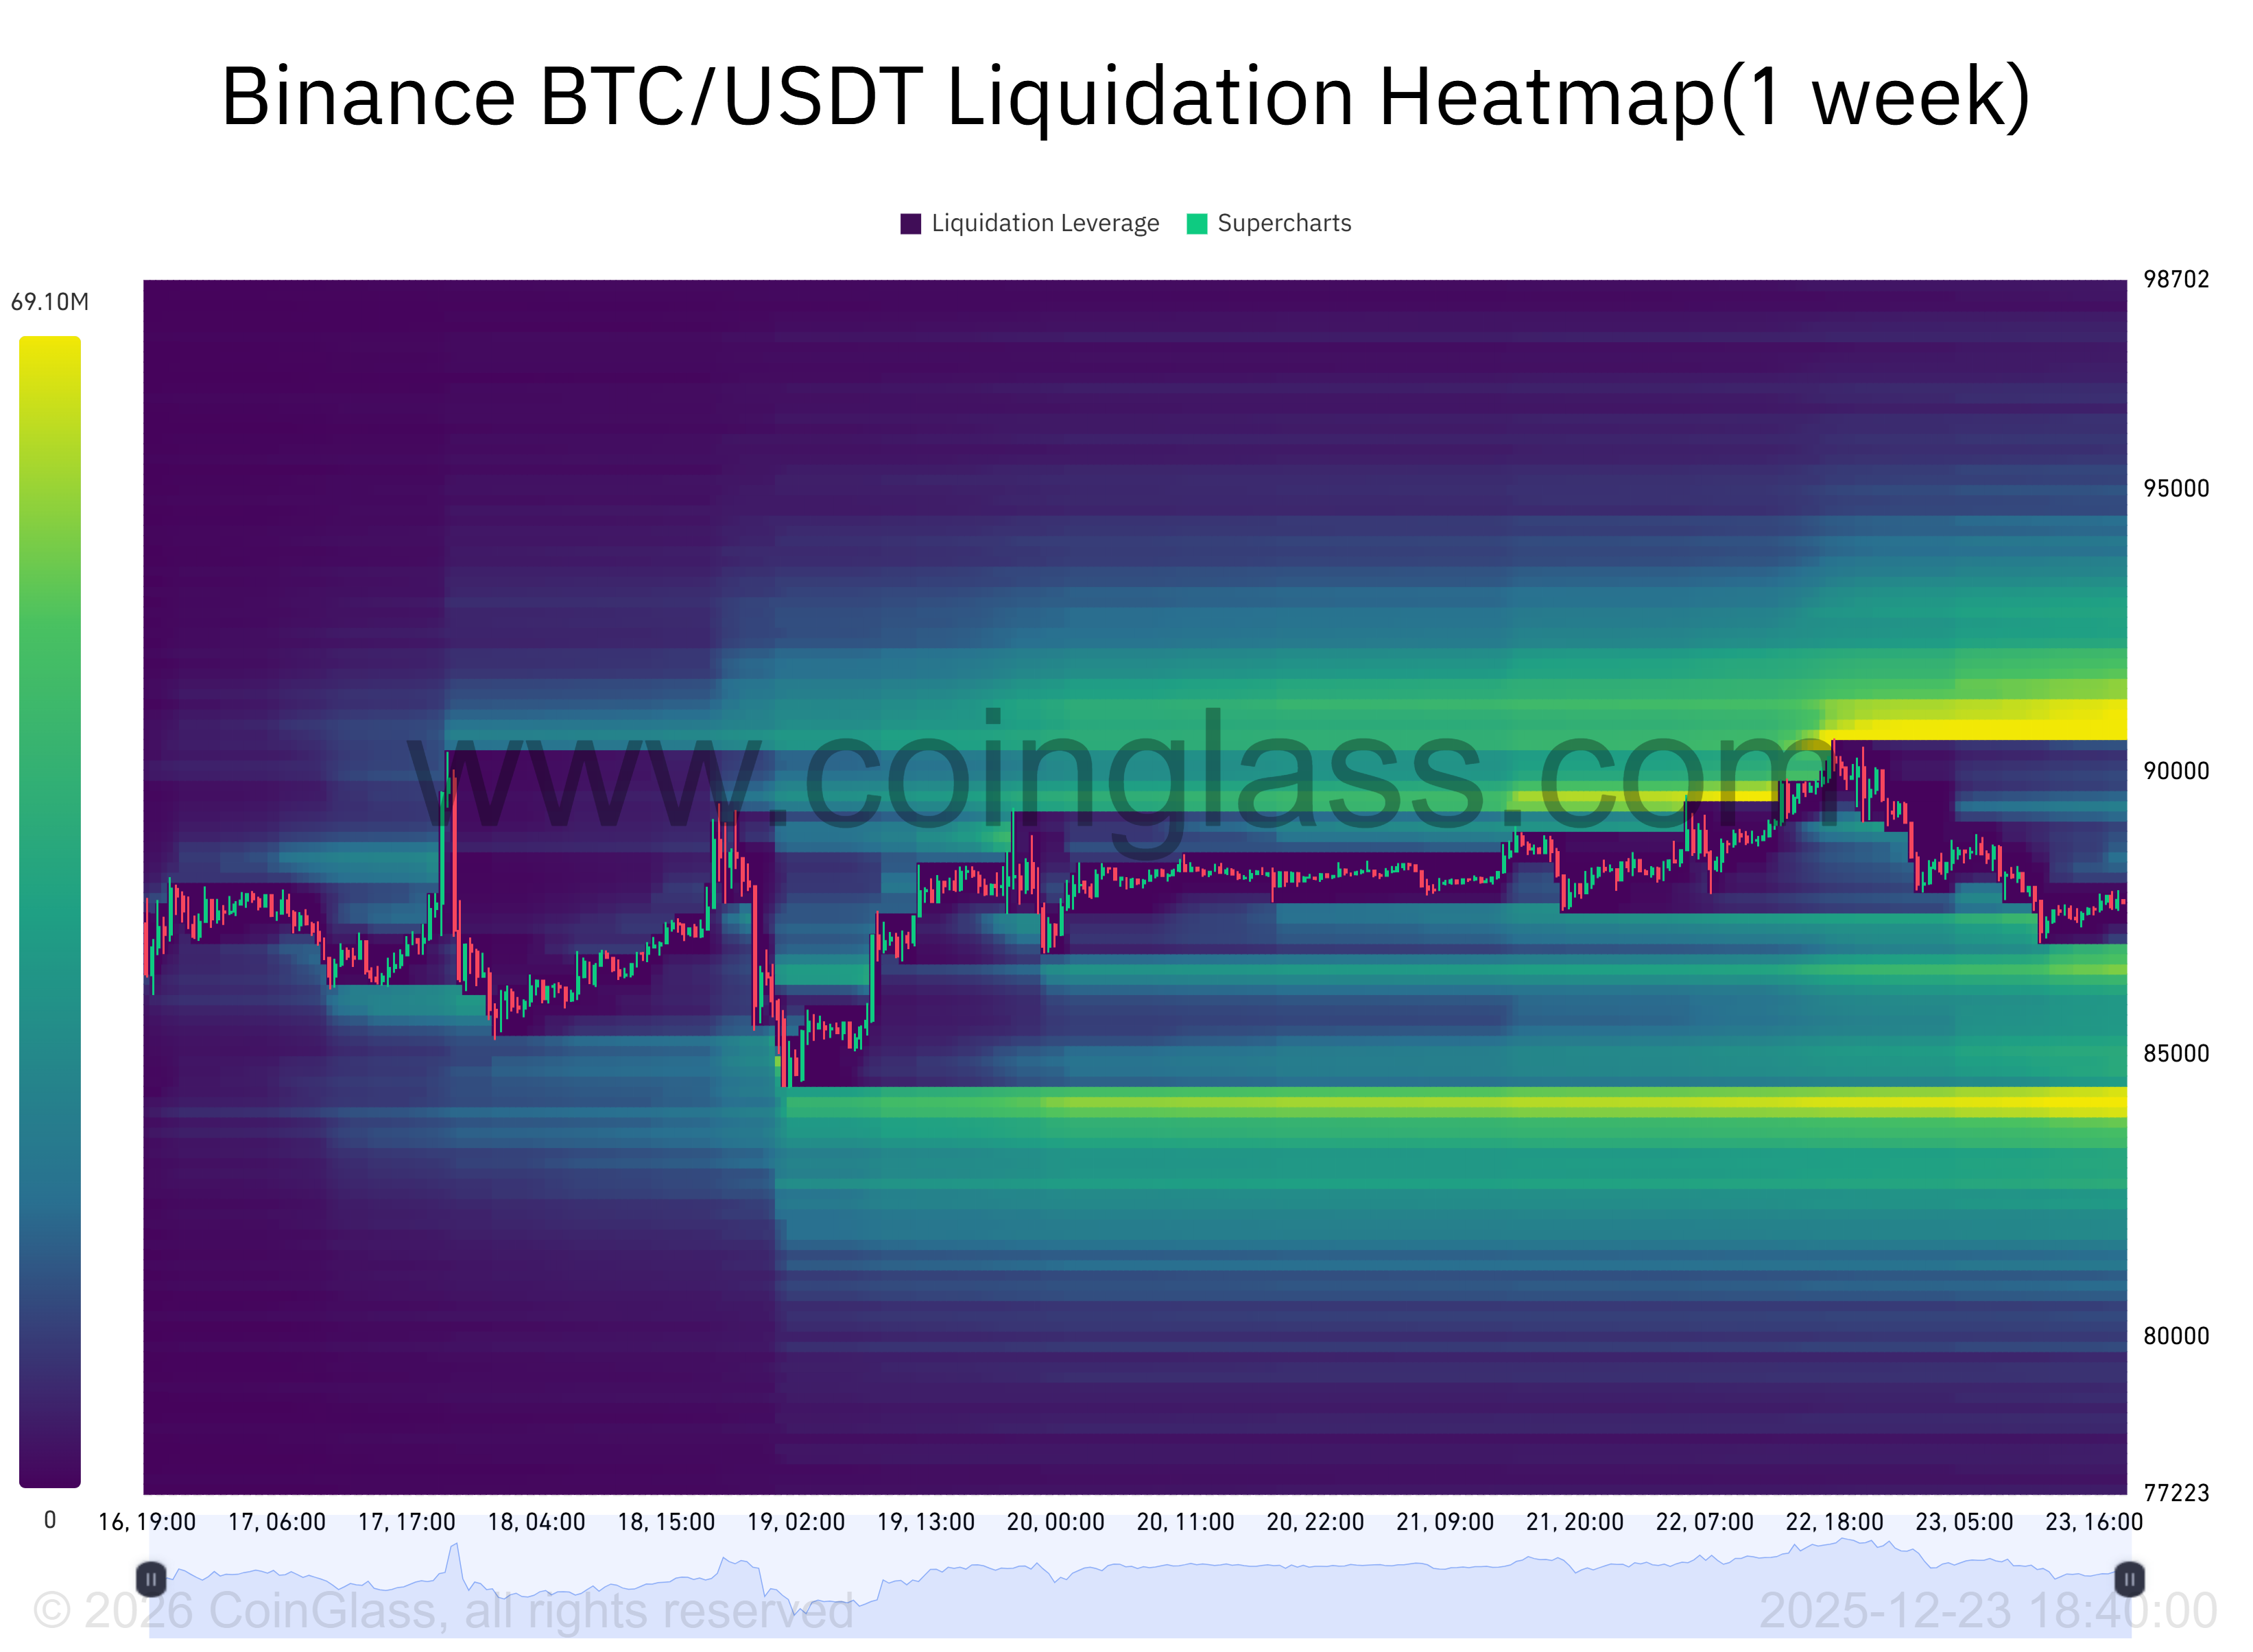 Bitcoin liquidation heatmap. Source: CoinGlass
Overall, Bitcoin’s near-term trajectory will likely hinge on which side of the range it tests first, as liquidity zones above and below the current price provide potential targets for both bullish and bearish traders.
This analysis underscores a phase of market consolidation driven by reduced on-chain activity and tight liquidity, suggesting traders remain cautious as the asset consolidates within defined support and resistance thresholds.
This article was originally published as Bitcoin Stuck Below $90,000 — Key Metrics Must Shift for Breakout on Crypto Breaking News – your trusted source for crypto news, Bitcoin news, and blockchain updates.
You May Also Like

Nearly One-in-Four Workers ‘Functionally Unemployed,’ Says Ludwig Institute

Upcoming US Crypto Legislation and Policies to Watch in 2026

The Protocol: Aave community split
Copy linkX (Twitter)LinkedInFacebookEmail