

Data review of Ethereum’s “darkest moment”: $380 million in contracts liquidated, pledges continue to flow out, and inflation returns
Author: PANews, Frank
On February 3, the crypto market ushered in another dark moment, and the entire crypto market experienced a sharp drop in a short period of time. Within 24 hours, the number of people whose cryptocurrency positions were liquidated on the entire network reached 720,000, with a total amount of US$2.21 billion (due to incomplete data statistics, Bybit CEO Ben Zhou speculated that the real data may reach US$8 to 10 billion), of which US$1.87 billion was liquidated on long orders and US$340 million was liquidated on short orders. Ethereum was particularly eye-catching in this round of plunge, and it plunged 25% on the same day, setting the largest single-day drop in nearly four years (since May 2021). In addition, the total liquidation amount of Ethereum on that day reached US$380 million, exceeding the liquidation amount of Bitcoin contracts.
After this round of liquidation, the market's disappointment with Ethereum has reached its peak. There are also rumors that some industry whales or institutions were liquidated in this round of market, which caused the ETH to plummet. So, after experiencing this storm, what are the current fundamentals of Ethereum? PANews analyzes the contract holdings, ETF fund inflows, on-chain data, token inflation and other aspects to see the overall picture of Ethereum.
Prices wiped out one-year gains, and contract open interest hit new highs
First of all, from the price point of view, Ethereum hit a low of $2,125 this round, which is not as low as the $2,111 in August 2024. But this time the single-day fluctuation is larger, which is very lethal to the contract market. From the high point of $4,107 to the lowest point in this round, the callback in the past 50 days has reached 48%, and the price has almost returned to the level of the beginning of 2024. This is also the reason for the resentment of long-term holders.
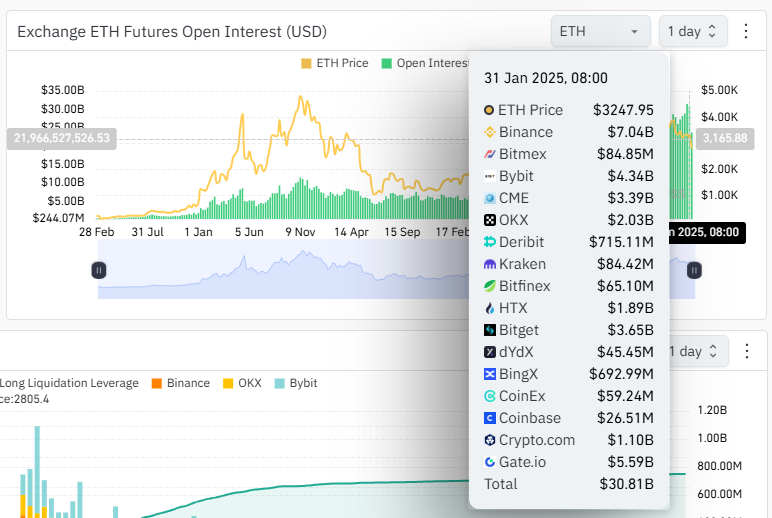
Although Ethereum's market performance has not been impressive in the past year, judging from the contract positions, Ethereum's open positions on various exchanges have been increasing and have repeatedly broken historical records. According to coinglass data, as of January 31, the total contract positions of Ethereum reached US$30 billion, while when Ethereum reached its historical high of US$4,800 in 2021, this figure was only US$11.4 billion. As the market plummeted, as of February 5, the amount of open contracts for Ethereum on major exchanges fell to US$23.7 billion, a drop of nearly US$7 billion.
From the comparison between holdings and prices, it can be seen that there seems to be a huge difference between the market expectations and actual expectations of Ethereum, which has led to continuous bets from funds, resulting in this round of sharp fluctuations in short-term declines.
Is the U.S. spot ETF market a good place to buy at the bottom recently?
In terms of the inflow of funds into the Ethereum ETF in the United States, starting from November 6, it can be seen that the net inflow of funds into the Ethereum ETF of various institutions has increased significantly. The highest single-day net inflow was US$428 million on December 5. Of course, as the price of Ethereum fluctuates greatly, the amount of net inflow and net outflow per day has increased significantly. On January 8, the net outflow of ETFs in a single day also reached US$159 million, setting a record high. On February 3, although the price of Ethereum plummeted and the contract market suffered heavy losses. However, the funds of the ETF did not cause outflows. Instead, on February 4, it set the third highest record of net inflow of US$300 million per day. From this point of view, for traditional market institutions in the United States, it seems that they are rushing to buy chips in this range.
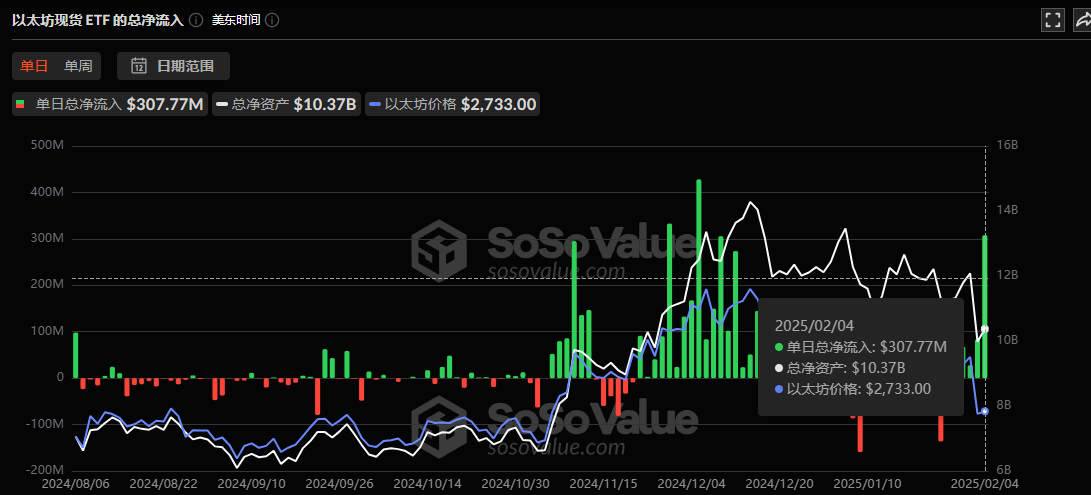
As of February 4, the data shows that the current total net asset value of Ethereum ETF is about 10.37 billion US dollars, accounting for 3.15% of the market value of Ethereum. In contrast, the total net asset value of BTC ETF is about 116 billion US dollars, accounting for about 5.93% of the market value, which is significantly higher than Ethereum. From this data, it can be seen that the current ETF has little impact on the market trend of Ethereum.
On-chain data is stagnant, and the amount of pledged funds continues to flow out
Of course, this round of decline is essentially caused by other macro factors. The plunge of Ethereum is only the most vulnerable link in this round of decline. Judging from the on-chain data, the number of daily active addresses of Ethereum just hit the second highest point in a year at 553,000 on January 25 before the plunge, and has been in a state of decline since then. In terms of on-chain revenue, the revenue level of the Ethereum mainnet is far lower than the same period a year ago. The daily revenue at the low point was only about 1 million US dollars. This may also explain why the inflow of on-chain staking has been negative since mid-November.
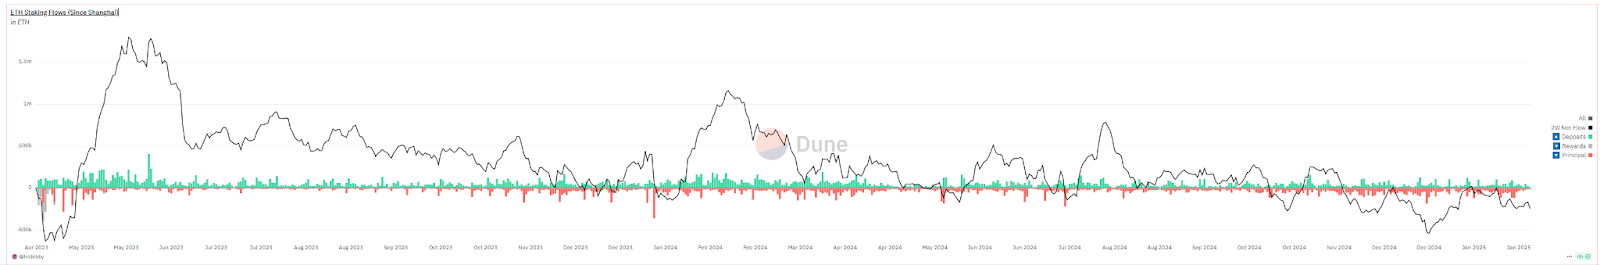
Data shows that since mid-November 2024, the net inflow of staking on the Ethereum chain has been negative within 2 weeks, with the largest single-day net outflow of 181,000. Judging from the current data, this data item is still below the 0 axis. This is the longest time that the data has been below the 0 axis since the Shanghai upgrade. Previously, from April 12 to April 30, 2023, there was a net outflow for more than half a month. At that time, the market trend was a decline after a short-term high, with a maximum correction of about 16%. This time, the net outflow has lasted for 84 days, and the maximum price correction from the high has reached nearly 50%.
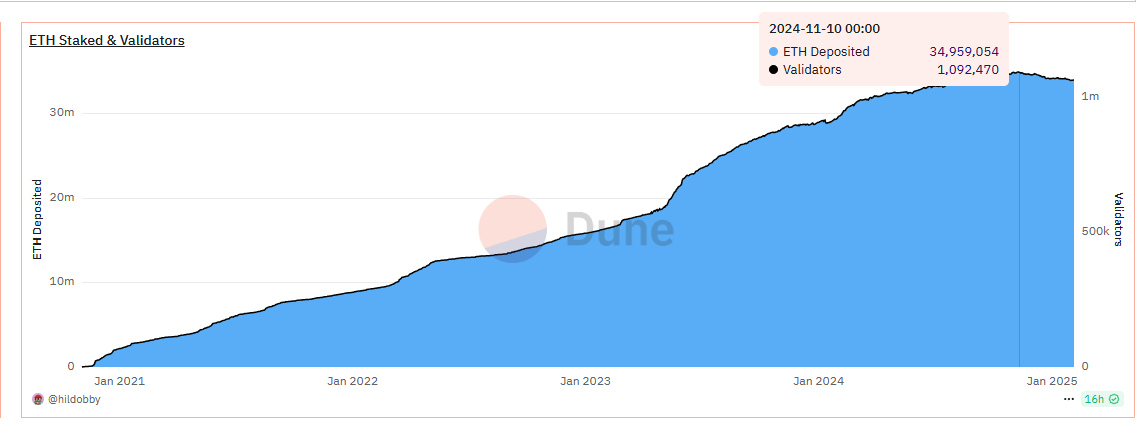
In terms of the number of pledges, the data reached a historical peak on November 10, 2024, which was about 34.95 million Ethereum, and the number of pledgers was 1.09 million. The data has now shown a downward trend, and the current number of pledges is about 34 million, and the number of pledgers is about 1.06 million.
In addition to the above, Ethereum's inflation has also become a focus of attention in the market recently. Since Ethereum switched from POW to POS, one of the major supply expectations of Ethereum in the market is that it will achieve a deflation model through token burning. However, people have recently discovered that after more than a year of deflation and inflation, the number of new Ethereum tokens has completely wiped out the deflation caused by the previous burning. As of February 5, data showed that Ethereum's inflation rate has returned to 0%, which is the same as before the merger. According to analysis, the main reason for this change is that the number of tokens burned on the chain has been reduced after the Dencun upgrade.
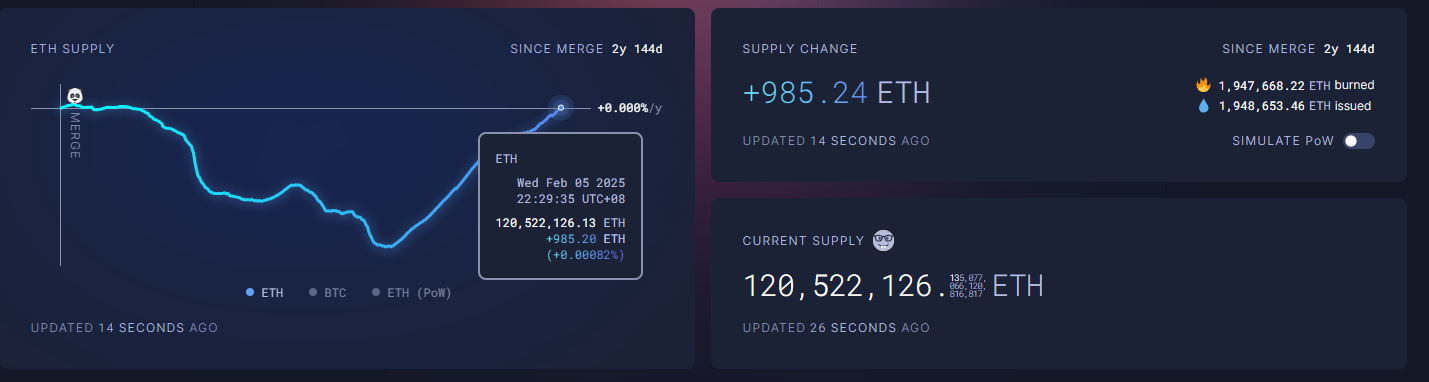
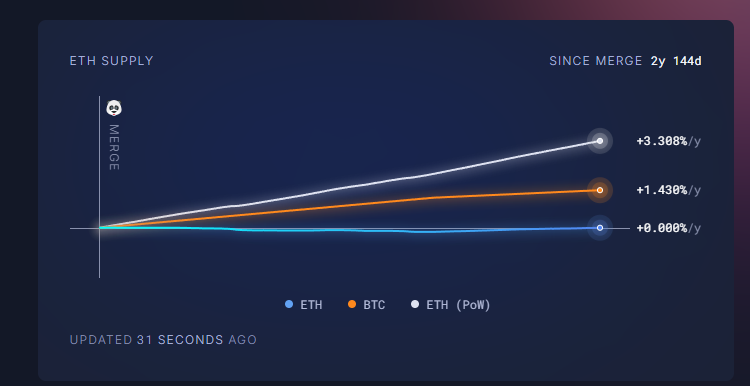
However, even so, compared with the POW issuance model, the inflation rate of POS is still much lower than that of the POW model. At the same time, Ethereum's current inflation rate is also lower than BTC.
Overall, this round of volatile market fluctuations in Ethereum was caused by external factors such as the overall market being affected by macro factors, as well as internal factors such as the continued rise in contract positions, the continued increase in bets, and the continued downturn caused by poor performance of on-chain data. The final result is that both long and short positions have declined significantly. After the plunge on February 3, the price quickly rose to more than $2,900 in the short term. At the same time, funds for US spot ETFs are generally inflowing, which further reflects the divergence between the spot market and the futures market.
Next, perhaps the biggest key to driving the market recovery lies in whether the various activity data of the Ethereum ecosystem can actually grow. Otherwise, the short-term trend will still be difficult to predict. For investors who are keen on leveraging and contracts, both bottom-fishing and short-selling are full of risks.
You May Also Like

Best Crypto to Buy as Saylor & Crypto Execs Meet in US Treasury Council

BlackRock boosts AI and US equity exposure in $185 billion models
