The post LayerZero (ZRO) Price Jumps 20% as Demand Outpaces Supply Unlocks appeared first on Coinpedia Fintech News LayerZero’s native token (ZRO) is gaining attentionThe post LayerZero (ZRO) Price Jumps 20% as Demand Outpaces Supply Unlocks appeared first on Coinpedia Fintech News LayerZero’s native token (ZRO) is gaining attention

LayerZero (ZRO) Price Jumps 20% as Demand Outpaces Supply Unlocks

3 min read
ZRO Price Surges 50% For $3 Breakout, Teases Bull Run To $10

The post LayerZero (ZRO) Price Jumps 20% as Demand Outpaces Supply Unlocks appeared first on Coinpedia Fintech News

LayerZero’s native token (ZRO) is gaining attention as it surged 20% today, extending the rally over 42% this week. Despite ongoing token unlock concerns, buyers stepped in aggressively and lifted the ZRO price beyond the $2 hurdle. The rally appears to be fueled by a combination of whale accumulation, rising open interest, and a clean breakout. 

Now, with momentum shifting back to the upside, traders are watching this move marks a short-term relief rally or the start of a broader trend reversal, with key demand and resistance levels coming into focus.

Token Unlock Pressure Fades as Whales Absorb Supply 

The key driver behind the ZRO price rally is the fresh demand from the market. Roughly 32.6 million ZRO, about 3.26% of maximum supply is set to unlock every month through 2026, creating a visible and recurring supply overhang. 

ZRO token unlock

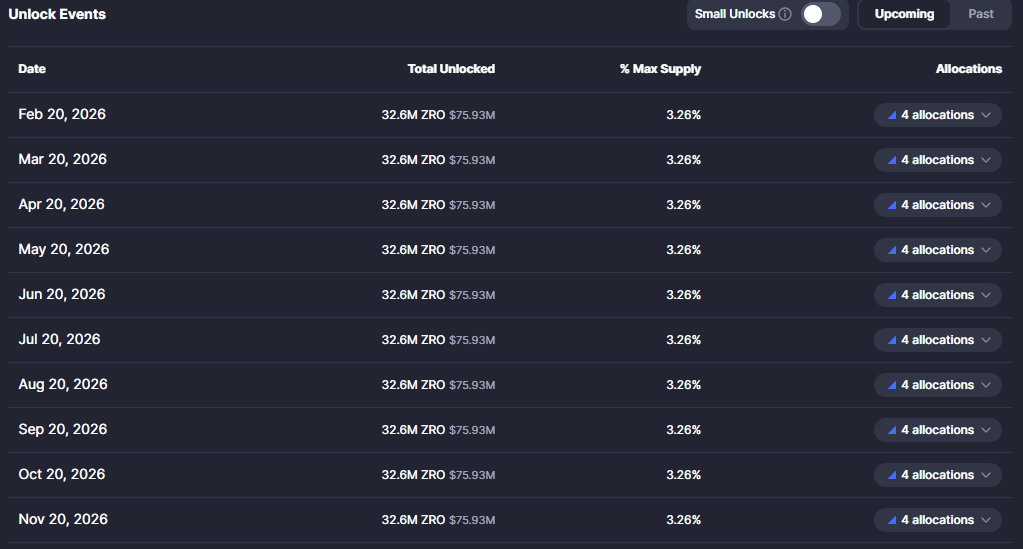
Under normal conditions, this kind of dilution leads to persistent selling pressure as early holders take advantage of liquidity. However, in ZRO’s case, the market responded differently.

Instead of breaking down, ZRO absorbed the fresh supply and continued moving higher. Further On-chain data shows that large wallets stepped in during the unlock window, not to distribute, but to build exposure. One major whale address opened a 5x leveraged long position worth nearly $800,000, while other high-value wallets increased activity through settlement flows.

The implication is clear, the unlock event did not weaken price because smart money treated it as an accumulation opportunity, not an exit point. When an asset rallies in full awareness of ongoing dilution, it signals that demand has overtaken supply as the dominant force in price discovery.

ZRO Price Action Signals Structural Breakout

ZRO’s price action displays a clean breakout of a long-term downtrend. After weeks of compression, LayerZero token price broke out of its descending trendline and closed decisively above the $2.20 resistance zone, which has previously rejected multiple upside attempts. The breakout was accompanied by sharp volume spurt and strong follow-on buying movement, suggesting real participation rather than a thin liquidity spike.

ZRO price

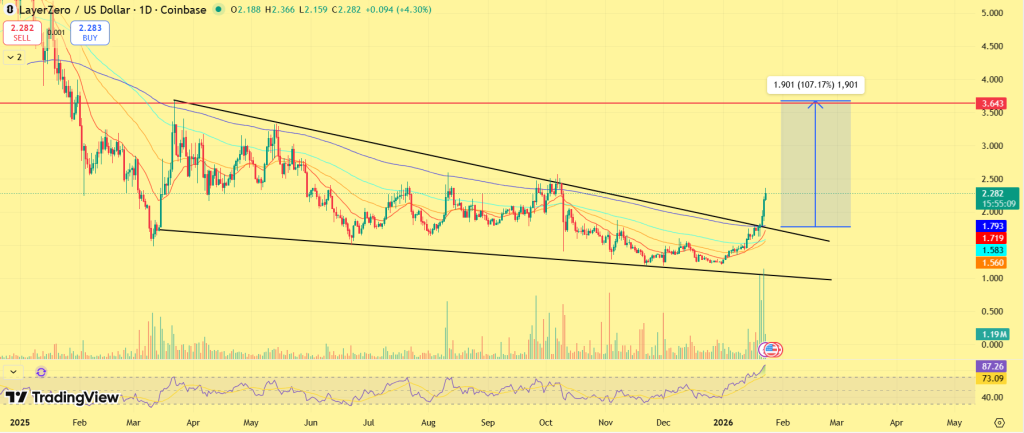
The broader chart structure now shows a shift from lower highs into higher highs and higher lows, confirming a transition from bearish consolidation into bullish expansion. With the former resistance now acting as support, the key demand area sits around $1.90–$2.00. 

As long as ZRO price holds above this region, the bullish structure remains intact. On the upside, the next major liquidity zone appears near $2.70, followed by a higher expansion region around $3.30–$3.60, which aligns with the measured move of the breakout pattern. Beyond that level, historical supply thins out, placing ZRO into a low-resistance price discovery range.

Disclaimer: The articles reposted on this site are sourced from public platforms and are provided for informational purposes only. They do not necessarily reflect the views of MEXC. All rights remain with the original authors. If you believe any content infringes on third-party rights, please contact service@support.mexc.com for removal. MEXC makes no guarantees regarding the accuracy, completeness, or timeliness of the content and is not responsible for any actions taken based on the information provided. The content does not constitute financial, legal, or other professional advice, nor should it be considered a recommendation or endorsement by MEXC.

You May Also Like

Securities Fraud Investigation Into Corcept Therapeutics Incorporated (CORT) Announced – Shareholders Who Lost Money Urged To Contact Glancy Prongay Wolke & Rotter LLP, a Leading Securities Fraud Law Firm

Securities Fraud Investigation Into Corcept Therapeutics Incorporated (CORT) Announced – Shareholders Who Lost Money Urged To Contact Glancy Prongay Wolke & Rotter LLP, a Leading Securities Fraud Law Firm

LOS ANGELES–(BUSINESS WIRE)–Glancy Prongay Wolke & Rotter LLP, a leading national shareholder rights law firm, today announced that it has commenced an investigation
Share
AI Journal2026/02/05 04:00
Microsoft Corp. $MSFT blue box area offers a buying opportunity

Microsoft Corp. $MSFT blue box area offers a buying opportunity

The post Microsoft Corp. $MSFT blue box area offers a buying opportunity appeared on BitcoinEthereumNews.com. In today’s article, we’ll examine the recent performance of Microsoft Corp. ($MSFT) through the lens of Elliott Wave Theory. We’ll review how the rally from the April 07, 2025 low unfolded as a 5-wave impulse followed by a 3-swing correction (ABC) and discuss our forecast for the next move. Let’s dive into the structure and expectations for this stock. Five wave impulse structure + ABC + WXY correction $MSFT 8H Elliott Wave chart 9.04.2025 In the 8-hour Elliott Wave count from Sep 04, 2025, we saw that $MSFT completed a 5-wave impulsive cycle at red III. As expected, this initial wave prompted a pullback. We anticipated this pullback to unfold in 3 swings and find buyers in the equal legs area between $497.02 and $471.06 This setup aligns with a typical Elliott Wave correction pattern (ABC), in which the market pauses briefly before resuming its primary trend. $MSFT 8H Elliott Wave chart 7.14.2025 The update, 10 days later, shows the stock finding support from the equal legs area as predicted allowing traders to get risk free. The stock is expected to bounce towards 525 – 532 before deciding if the bounce is a connector or the next leg higher. A break into new ATHs will confirm the latter and can see it trade higher towards 570 – 593 area. Until then, traders should get risk free and protect their capital in case of a WXY double correction. Conclusion In conclusion, our Elliott Wave analysis of Microsoft Corp. ($MSFT) suggested that it remains supported against April 07, 2025 lows and bounce from the blue box area. In the meantime, keep an eye out for any corrective pullbacks that may offer entry opportunities. By applying Elliott Wave Theory, traders can better anticipate the structure of upcoming moves and enhance risk management in volatile markets. Source: https://www.fxstreet.com/news/microsoft-corp-msft-blue-box-area-offers-a-buying-opportunity-202509171323
Share
BitcoinEthereumNews2025/09/18 03:50
Over 80% of 135 Ethereum L2s record below 1 user operation per second

Over 80% of 135 Ethereum L2s record below 1 user operation per second

The post Over 80% of 135 Ethereum L2s record below 1 user operation per second  appeared on BitcoinEthereumNews.com. Ethereum’s L2s are not doing too well. Data
Share
BitcoinEthereumNews2026/02/05 03:52