The post BNB Price Slides 6% as $900 Rejection Triggers Liquidation-Led Selloff appeared first on Coinpedia Fintech News Binance Coin (BNB) price extended its declineThe post BNB Price Slides 6% as $900 Rejection Triggers Liquidation-Led Selloff appeared first on Coinpedia Fintech News Binance Coin (BNB) price extended its decline

BNB Price Slides 6% as $900 Rejection Triggers Liquidation-Led Selloff

3 min read
CMB International BNB Chain

The post BNB Price Slides 6% as $900 Rejection Triggers Liquidation-Led Selloff appeared first on Coinpedia Fintech News

Binance Coin (BNB) price extended its decline on Friday as the broader crypto market slid into a risk-off phase. BNB price fell more than 6% intraday, extending losses after failing to reclaim the psychologically important $900 level. The move comes amid a wider selloff across Bitcoin and major altcoins, where rising liquidations and tightening macro conditions are accelerating downside momentum. As price slipped below key support zones, derivatives data shows the decline was not driven by spot selling alone. Instead, the move unfolded as a liquidation-led breakdown, exposing structural weakness built up during the prior consolidation.

BNB Price Breaks Down After $900 Rejection

BNB price chart shows clear signs of breakdown. The rejection at $900 marked a failure at a key supply zone that has capped upside attempts multiple times. Once BNB price lost the $880 support, selling pressure intensified, breaking the short-term higher-low structure and confirming a shift toward lower-highs and lower lows. The current selloff has pushed BNB below the $850 mark, with $880 now acting as resistance rather than support. 

BNB price

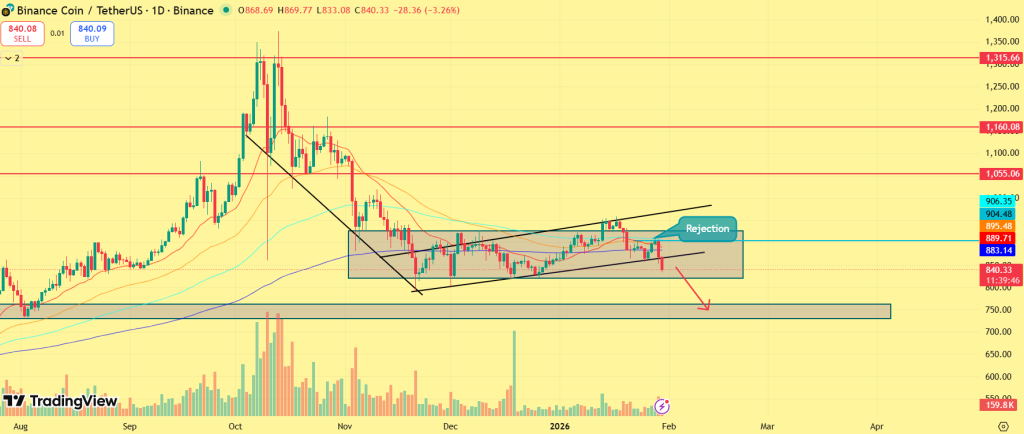
If downside pressure persists, the $800-$830 emerges as the next major demand zone, aligned with prior liquidity absorption. A deeper move could expose the $800 psychological level, especially if broader market weakness continues. On the upside, any rebound toward $860-880 is likely to face selling interest unless BNB can reclaim $900 with strong volume, a scenario that currently appears unlikely given the derivatives backdrop.

Liquidations and Funding Rates Confirm Deleveraging Phase

The sharp downside move in BNB was fueled by aggressive liquidation activity across derivatives markets. Liquidation heatmap data reveals dense long-position clusters stacked between $880 and $850, where leverage had accumulated over recent sessions. 

BNB liquidation map

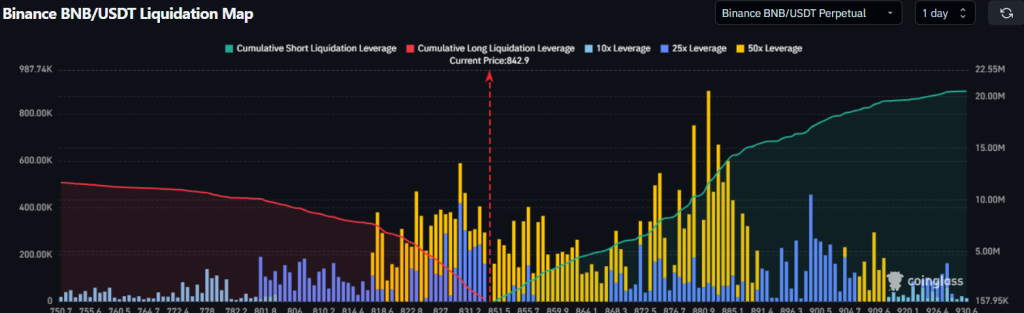
Once BNB was rejected at $900, price quickly moved into this liquidity pocket, triggering a cascade of forced closures. During the selloff, BNB-related liquidations exceeded $100 million, with long positions accounting for the bulk of the wipeout. This confirms that bullish positioning had become overcrowded near resistance, leaving the market vulnerable to a rapid flush once support gave way.

BNB funding rate

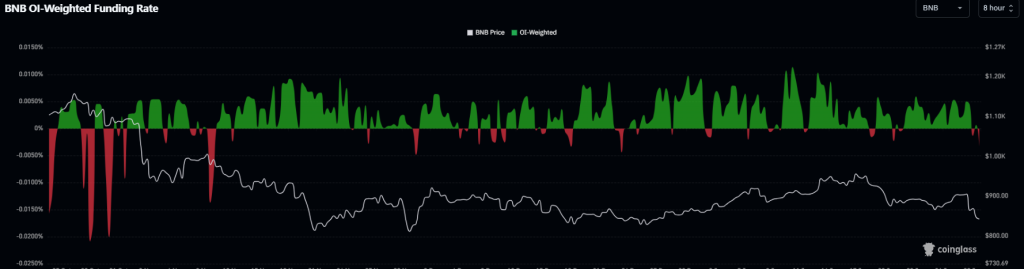
Funding rates across major perpetual contracts flipped decisively negative, sliding into the -0.01% to -0.02% range, signalling traders paying a premium to stay short. At the same time, open interest dropped by roughly 8–10%, showing that leverage was being forcibly removed rather than rotated into new positions. Together, negative funding, falling open interest, and clustered liquidations point to a structural leverage reset, not a one-off panic move.

Final Thoughts

BNB’s price rejection at $900 has shifted the short-term trend firmly bearish, with liquidation-driven selling exposing fragile market structure. Until leverage resets and price stabilizes above key resistance, downside risks remain dominant. For now, traders are watching whether demand can re-emerge near support, or if further deleveraging extends the decline.

Disclaimer: The articles reposted on this site are sourced from public platforms and are provided for informational purposes only. They do not necessarily reflect the views of MEXC. All rights remain with the original authors. If you believe any content infringes on third-party rights, please contact service@support.mexc.com for removal. MEXC makes no guarantees regarding the accuracy, completeness, or timeliness of the content and is not responsible for any actions taken based on the information provided. The content does not constitute financial, legal, or other professional advice, nor should it be considered a recommendation or endorsement by MEXC.

You May Also Like

Securities Fraud Investigation Into Corcept Therapeutics Incorporated (CORT) Announced – Shareholders Who Lost Money Urged To Contact Glancy Prongay Wolke & Rotter LLP, a Leading Securities Fraud Law Firm

Securities Fraud Investigation Into Corcept Therapeutics Incorporated (CORT) Announced – Shareholders Who Lost Money Urged To Contact Glancy Prongay Wolke & Rotter LLP, a Leading Securities Fraud Law Firm

LOS ANGELES–(BUSINESS WIRE)–Glancy Prongay Wolke & Rotter LLP, a leading national shareholder rights law firm, today announced that it has commenced an investigation
Share
AI Journal2026/02/05 04:00
Microsoft Corp. $MSFT blue box area offers a buying opportunity

Microsoft Corp. $MSFT blue box area offers a buying opportunity

The post Microsoft Corp. $MSFT blue box area offers a buying opportunity appeared on BitcoinEthereumNews.com. In today’s article, we’ll examine the recent performance of Microsoft Corp. ($MSFT) through the lens of Elliott Wave Theory. We’ll review how the rally from the April 07, 2025 low unfolded as a 5-wave impulse followed by a 3-swing correction (ABC) and discuss our forecast for the next move. Let’s dive into the structure and expectations for this stock. Five wave impulse structure + ABC + WXY correction $MSFT 8H Elliott Wave chart 9.04.2025 In the 8-hour Elliott Wave count from Sep 04, 2025, we saw that $MSFT completed a 5-wave impulsive cycle at red III. As expected, this initial wave prompted a pullback. We anticipated this pullback to unfold in 3 swings and find buyers in the equal legs area between $497.02 and $471.06 This setup aligns with a typical Elliott Wave correction pattern (ABC), in which the market pauses briefly before resuming its primary trend. $MSFT 8H Elliott Wave chart 7.14.2025 The update, 10 days later, shows the stock finding support from the equal legs area as predicted allowing traders to get risk free. The stock is expected to bounce towards 525 – 532 before deciding if the bounce is a connector or the next leg higher. A break into new ATHs will confirm the latter and can see it trade higher towards 570 – 593 area. Until then, traders should get risk free and protect their capital in case of a WXY double correction. Conclusion In conclusion, our Elliott Wave analysis of Microsoft Corp. ($MSFT) suggested that it remains supported against April 07, 2025 lows and bounce from the blue box area. In the meantime, keep an eye out for any corrective pullbacks that may offer entry opportunities. By applying Elliott Wave Theory, traders can better anticipate the structure of upcoming moves and enhance risk management in volatile markets. Source: https://www.fxstreet.com/news/microsoft-corp-msft-blue-box-area-offers-a-buying-opportunity-202509171323
Share
BitcoinEthereumNews2025/09/18 03:50
Over 80% of 135 Ethereum L2s record below 1 user operation per second

Over 80% of 135 Ethereum L2s record below 1 user operation per second

The post Over 80% of 135 Ethereum L2s record below 1 user operation per second  appeared on BitcoinEthereumNews.com. Ethereum’s L2s are not doing too well. Data
Share
BitcoinEthereumNews2026/02/05 03:52