

Bitcoin (BTC) Holds Steady as Wall Street Analyst Projects 35% Market Crash Risk
TLDR
- Veteran analyst Ed Yardeni increased U.S. stock market crash probability from 20% to 35%
- Crude oil surpassing $100 per barrel drives inflation concerns and growth slowdown fears
- Bitcoin (BTC) maintains support around $67,000, showing resilience against declining equity markets
- NYDIG data reveals only 25% of Bitcoin price action correlates with traditional stock movements
- Leadership transition in Iran amplifies geopolitical tensions and market volatility
Prominent Wall Street analyst Ed Yardeni has dramatically increased his forecast for a potential U.S. stock market crash, raising the probability to 35% for the remainder of 2025 from his previous 20% estimate. Simultaneously, his outlook for a sustained market rally plummeted to merely 5%, down from 20%.
This revised forecast emerges as crude oil prices breached the $100 per barrel threshold. Elevated energy costs present a dual threat: amplifying inflationary pressures while simultaneously hampering economic expansion, creating headwinds for both equity and cryptocurrency markets.
Tensions between Washington and Tehran continue intensifying. Following Iran’s refusal to de-escalate, President Trump has warned of additional military action. The Islamic Republic recently appointed Mojtaba Khamenei, son of the late Ali Khamenei who perished in a U.S. operation, as its new supreme leader. Senior Iranian security officials have declared that Trump “must pay the price” for the ongoing conflict.
Bitcoin hovered around $67,378 during Monday’s trading session, registering a modest 1% gain over the preceding 24-hour period. This represents notable stability considering the volatility gripping conventional financial markets.
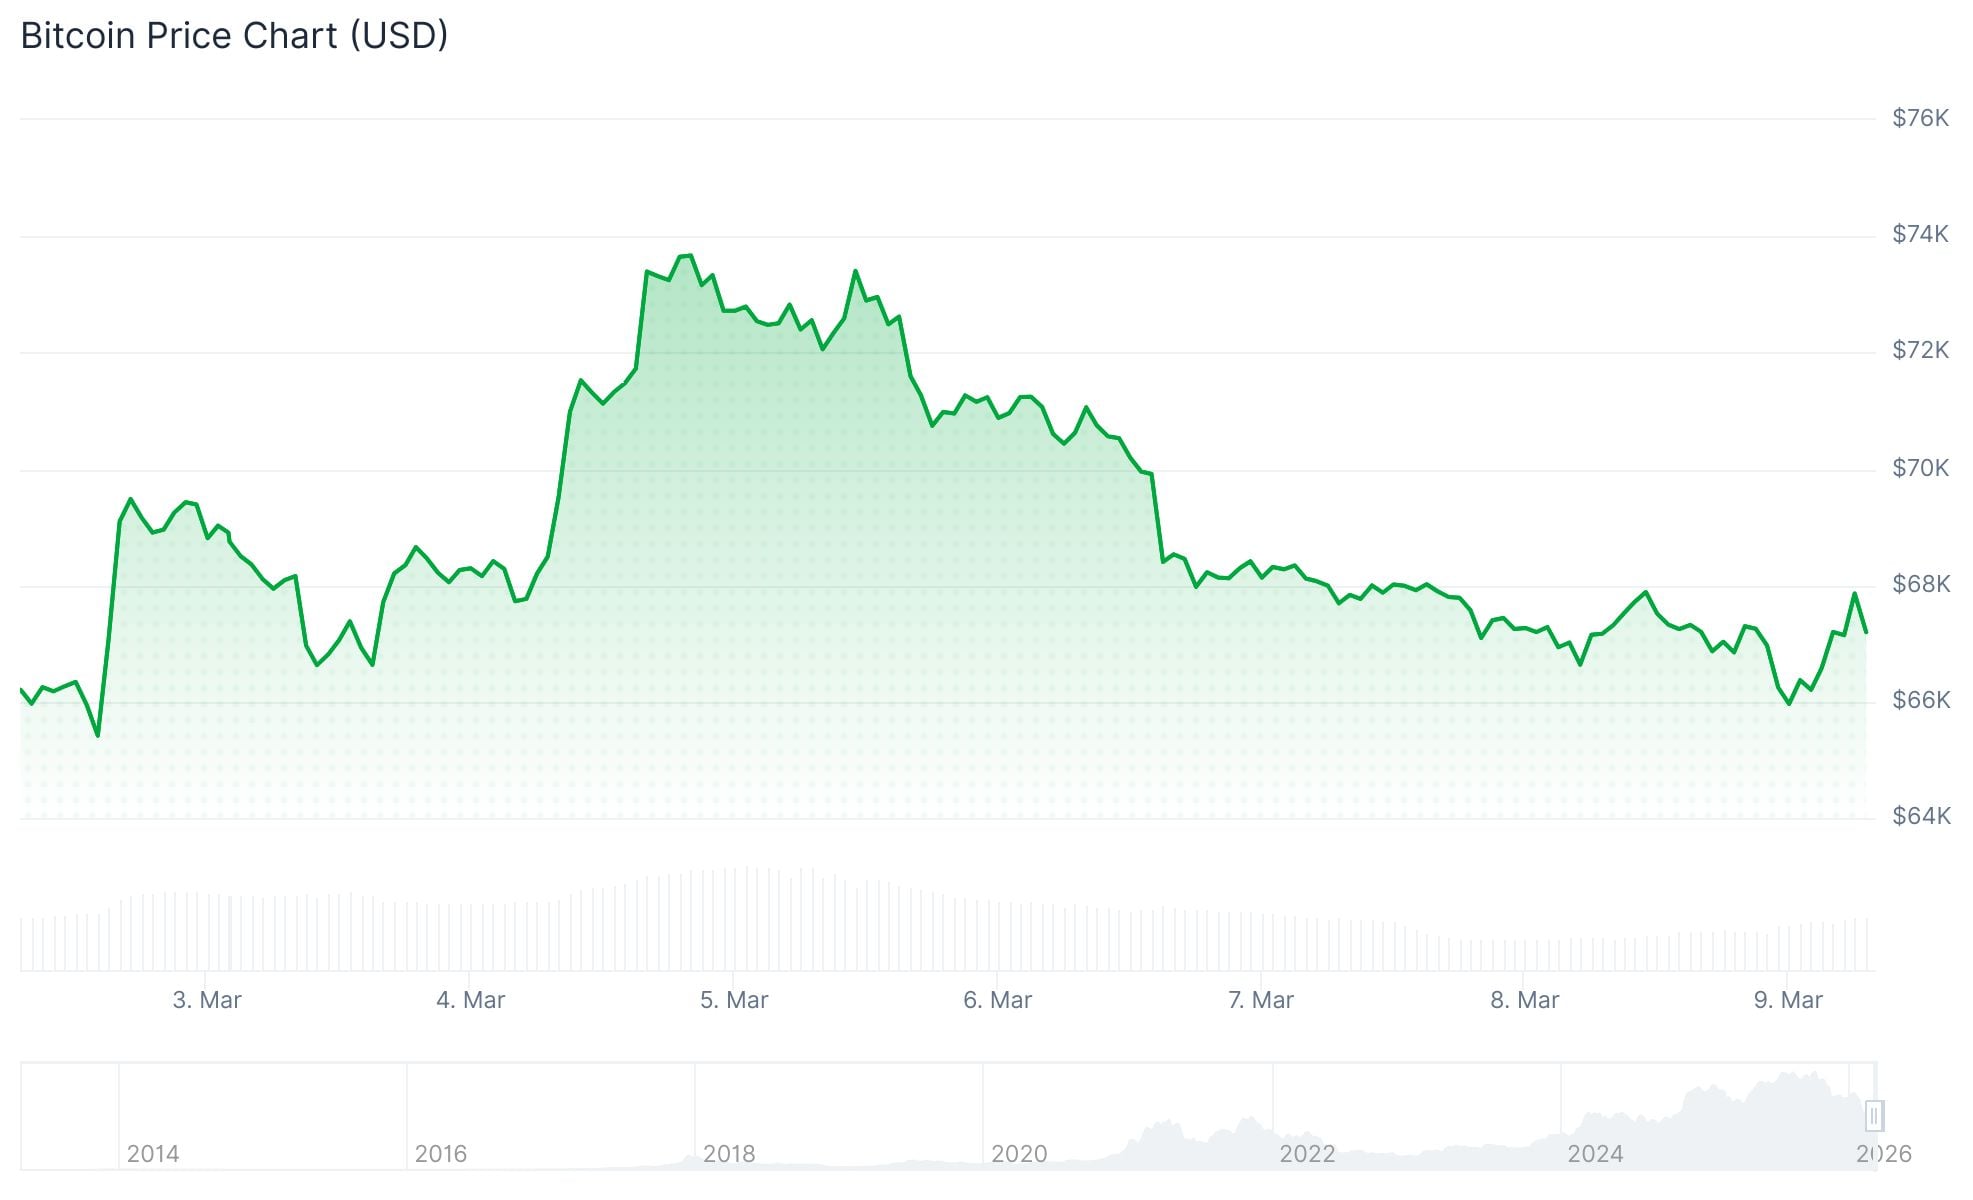 Bitcoin (BTC) Price
S&P 500 futures plummeted over 2% during Asian market hours. The VIX volatility index, commonly referred to as Wall Street’s fear gauge, reached levels not witnessed since the tariff-induced turbulence of April 2024. Meanwhile, the U.S. dollar recorded its strongest weekly performance in twelve months.
International markets experienced severe disruption. The MSCI global equity index tumbled 3.7% during the prior week. South Korean markets continue struggling to recover from their historic two-day collapse. Hedge funds have substantially increased short exposure across U.S. equity exchange-traded funds.
Market participants have also adjusted Federal Reserve rate cut expectations, now anticipating the next reduction in September. Prior to the conflict eruption in late February, traders had completely priced in a July rate cut.
Bitcoin’s Price Is Not Fully Tied to Stocks
Analysis conducted by NYDIG indicates that approximately 25% of Bitcoin’s price fluctuations can be attributed to correlation with U.S. equity markets. The remaining 75% stems from cryptocurrency-specific market dynamics.
Greg Cipolaro, NYDIG’s research director, explained that Bitcoin’s recent parallel movement with software sector stocks reflects mutual sensitivity to prevailing economic conditions rather than fundamental structural linkage.
Nevertheless, Bitcoin has consistently declined alongside equities throughout every significant risk-aversion episode since 2020.
Crypto-Linked Stocks Also Feel the Pressure
Equities connected to the cryptocurrency sector have experienced substantial volatility as investor caution intensifies. Bitcoin mining operation Core Scientific liquidated portions of its Bitcoin reserves while transitioning toward an artificial intelligence-centric business model. Share prices declined around the divestment period.
Ether gained 2.3% to approximately $1,981. Solana advanced 1.8% to $83.69 but remains the poorest performer among major cryptocurrencies on a seven-day basis, still registering a 1.5% weekly decline.
Ten-year Treasury yields surged six basis points as bond markets incorporated higher inflation expectations stemming from elevated petroleum costs.
The S&P 500 declined 2% during the previous week, demonstrating relative outperformance compared to international counterparts, partially due to America’s substantial domestic energy production capacity.
Remember: Preserve all tokens like [[EMBED_0]], [[IMG_0]], [[LINK_START_0]], [[LINK_END_0]], [[SCRIPT_0]], [[FIGURE_0]] etc. exactly as they appear. These are placeholders for embeds, images, and links that must not be changed.
The post Bitcoin (BTC) Holds Steady as Wall Street Analyst Projects 35% Market Crash Risk appeared first on Blockonomi.
You May Also Like

Litecoin Fluctuates Below The $116 Threshold

XRP Price Watch: Price Action Tightens in Micro Range as Bulls Seek Control
