

Bitcoin (BTC) Price Crushes Gold and S&P 500 Performance During U.S.-Iran Conflict
Key Takeaways
- BTC experienced an initial 8.5% decline at the onset of U.S.-Iran hostilities but has recovered approximately 11% from its nadir.
- Successive conflict escalations have prompted temporary selloffs, yet purchasing activity emerges at progressively elevated price points.
- Bitcoin’s performance has surpassed both gold and the S&P 500 during the identical fourteen-day timeframe.
- Major Bitcoin holders (whales) have resumed accumulation around the $71,000 mark, now possessing 68.17% of circulating supply.
- Blockchain analytics indicate minimal selling pressure between present levels and approximately $82,000.
Bitcoin’s current market valuation stands at $71,500.
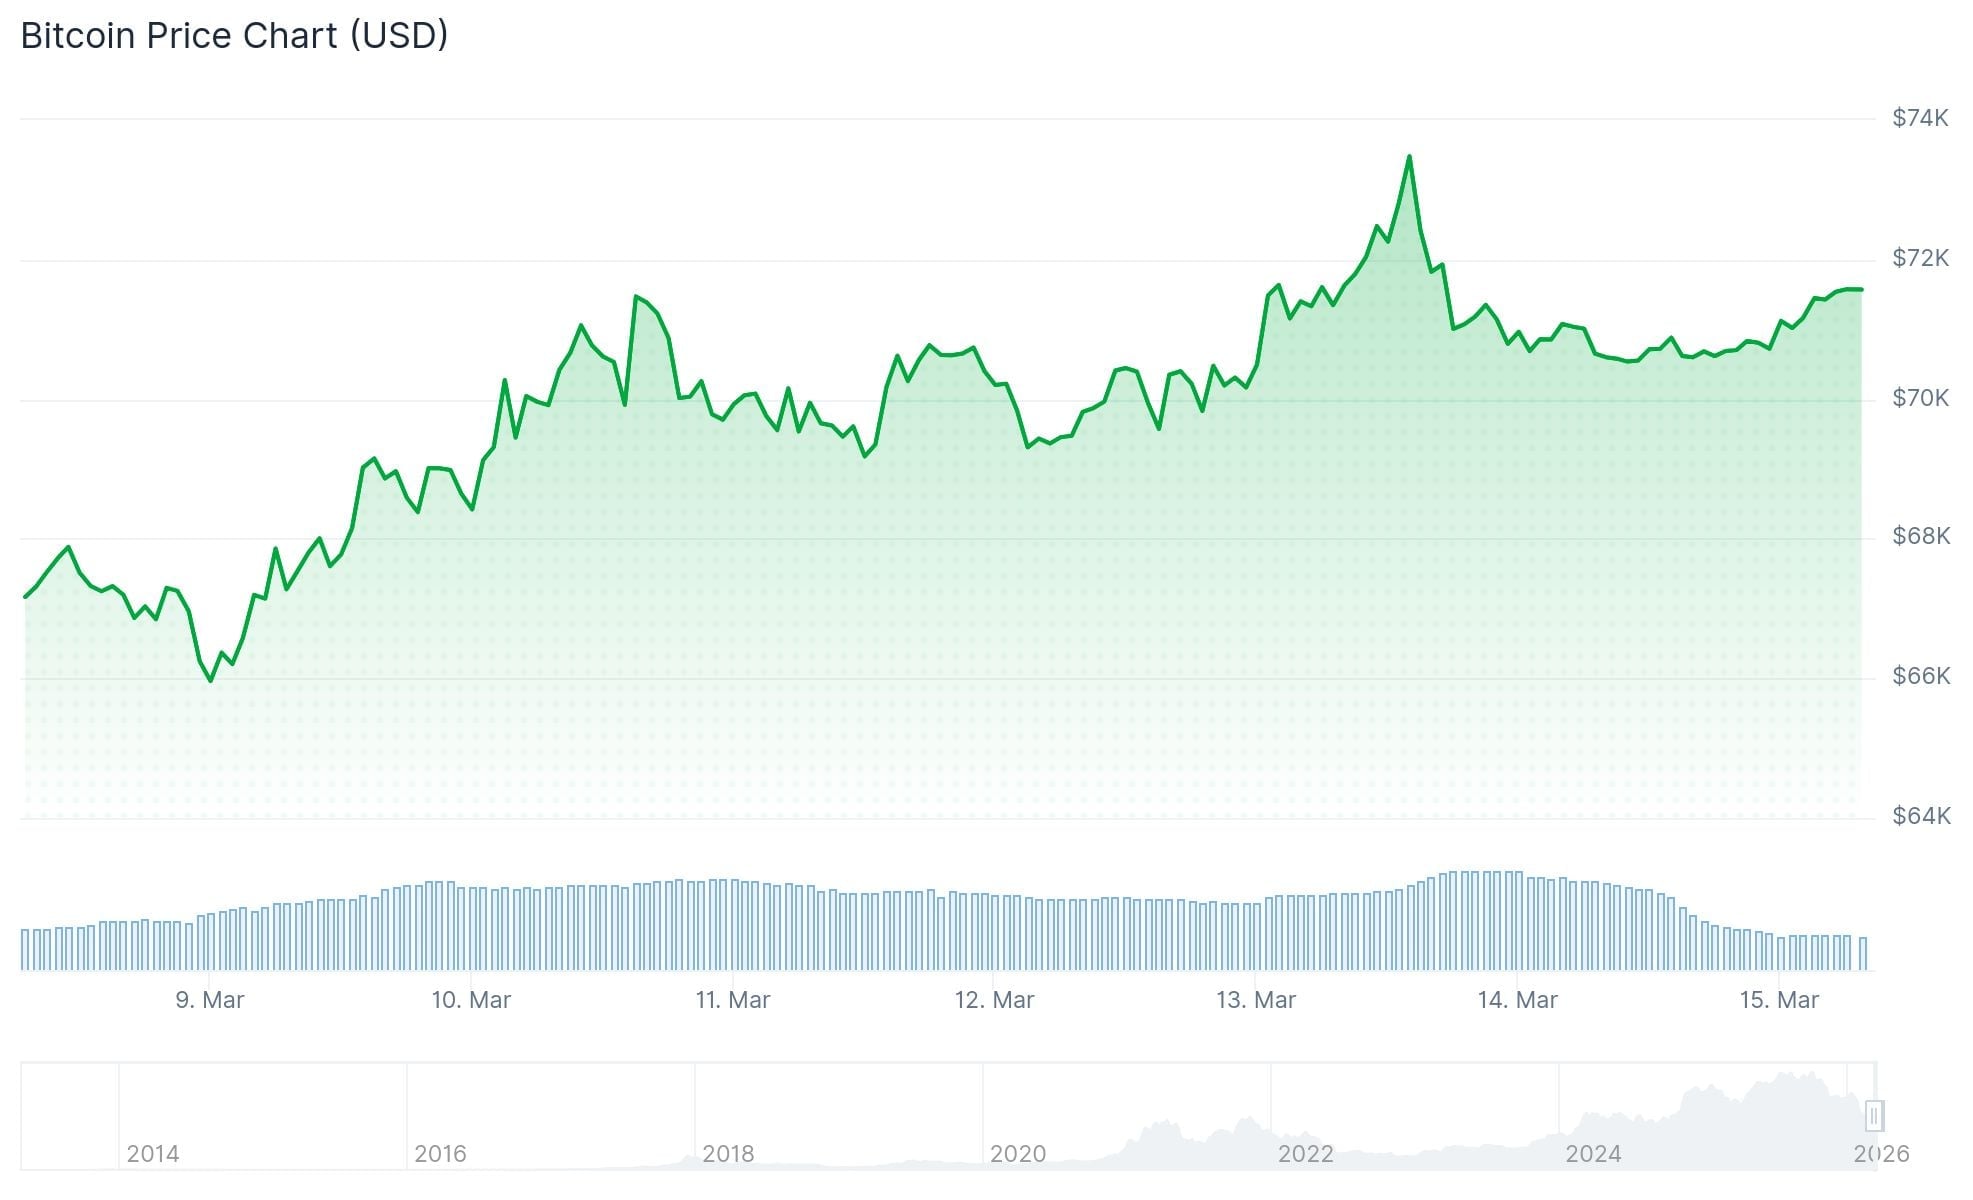 Bitcoin (BTC) Price
Hostilities between the U.S. and Iran commenced on Saturday, February 28. As the sole major trading market operating that day, Bitcoin experienced an 8.5% correction down to $64,000—marking its cycle bottom.
Fast forward fourteen days, and the landscape has transformed considerably.
BTC has surged approximately 11% from that trough, currently exchanging hands near $71,500. During this identical period, gold has exhibited extreme volatility, the S&P 500 has declined, and Asian stock markets endured their most severe weekly losses since 2020. Only crude oil—surging over 40%—and the greenback have exceeded Bitcoin’s gains. Both assets benefit directly from wartime conditions.
Progressive Support Levels Following Each Dip
Each military escalation since late February has initiated a Bitcoin price retreat. However, purchasing power has consistently materialized at increasingly higher thresholds.
Following Iran’s counter-strike missile barrage on March 2, BTC stabilized at $66,000. After seven consecutive days of sustained military operations on March 7, the floor elevated to $68,000. In response to commercial tanker incidents on March 12, Bitcoin maintained $69,400. Post-Kharg Island offensive on March 14, support crystallized at $70,596.
This pattern reveals ascending support increments of approximately $1,000–$2,000 following each geopolitical development.
Simultaneously, Bitcoin has encountered resistance near the $73,000–$74,000 zone on four separate occasions. This upper boundary remains intact. Market dynamics suggest an impending resolution—either BTC penetrates the $74,000 threshold, or intensified conflict finally overwhelms demand.
Earlier in 2026, a rapid liquidation cascade eliminated $2.5 billion in leveraged positions during a single weekend session, forcing Bitcoin down to $77,000. That purge appears to have eliminated excessive leverage, creating a market structure better equipped to withstand repeated conflict-related news without comparable disruption.
Whale Accumulation Pattern Emerges, Blockchain Metrics Suggest $82K Target
Analytics from cryptocurrency intelligence platform Santiment reveal substantial Bitcoin wallets—those containing 10 to 10,000 BTC—have reinitiated accumulation strategies around $71,000.
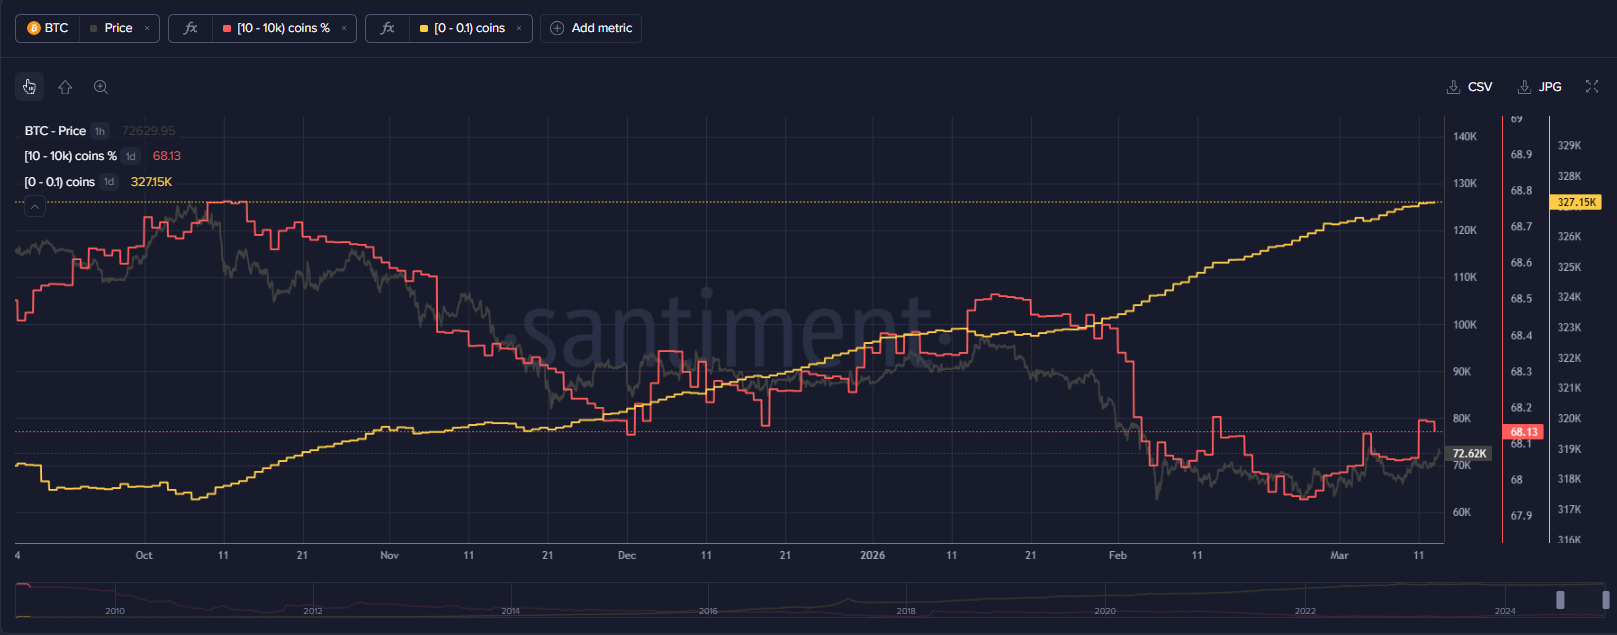 Source: Santiment
These addresses now command 68.17% of Bitcoin’s aggregate supply, increasing from 68.07% seven days prior. Santiment characterized this movement as a “positive reversal.” The analytics firm monitors retail investor behavior, as historical patterns indicate their capitulation often coincides with cyclical bottoms.
The Crypto Fear & Greed Index registered 16 on Sunday—deep within “Extreme Fear” territory.
U.S. spot Bitcoin ETFs recorded their inaugural five-consecutive-day inflow sequence of 2026 this week, attracting approximately $767 million in fresh capital.
Blockchain analyst Ali Martinez, referencing the UTXO Realized Price Distribution framework, identified minimal resistance between current valuations and approximately $82,045. The $74,000 rejection area, he observed, demonstrates sparse investor cost-basis density, implying it may prove less formidable than technical charts suggest.
The subsequent major support beneath current trading ranges appears around $66,898.
Bitcoin has appreciated 7.55% across the trailing 30-day period. BTC presently trades at $71,500.
The post Bitcoin (BTC) Price Crushes Gold and S&P 500 Performance During U.S.-Iran Conflict appeared first on Blockonomi.
You May Also Like

Trump seeks global help to keep Hormuz Strait ‘open and safe’

Mega Matrix: Regulatory uncertainty surrounding stablecoins may put traditional banks under greater pressure than crypto companies.
