Ethereum Price Forecast: ETH retest $4,000 as its funding rates flips negative
Ethereum price today: $4,150
- Ethereum funding rates have declined considerably, flashing negative for the second time over the past week.
- Ethereum ETFs have recorded two consecutive days of outflows, totalling $216 million.
- ETH continues to test the $4,000 support following its weak performance below the 20 and 50-day SMAs.
Ethereum (ETH) bounced off the $4,000 support on Wednesday as its funding rates flipped negative amid steady outflows in ETFs tracking its price.
ETH funding rates indicate rising short positioning
Ethereum funding rates turned negative on Wednesday, marking the second time this week, after flashing red on Monday following the large leverage flush.
The top altcoin's funding rates declined to -0.0021 over the past 24 hours, marking a deeper decline than that of Monday.
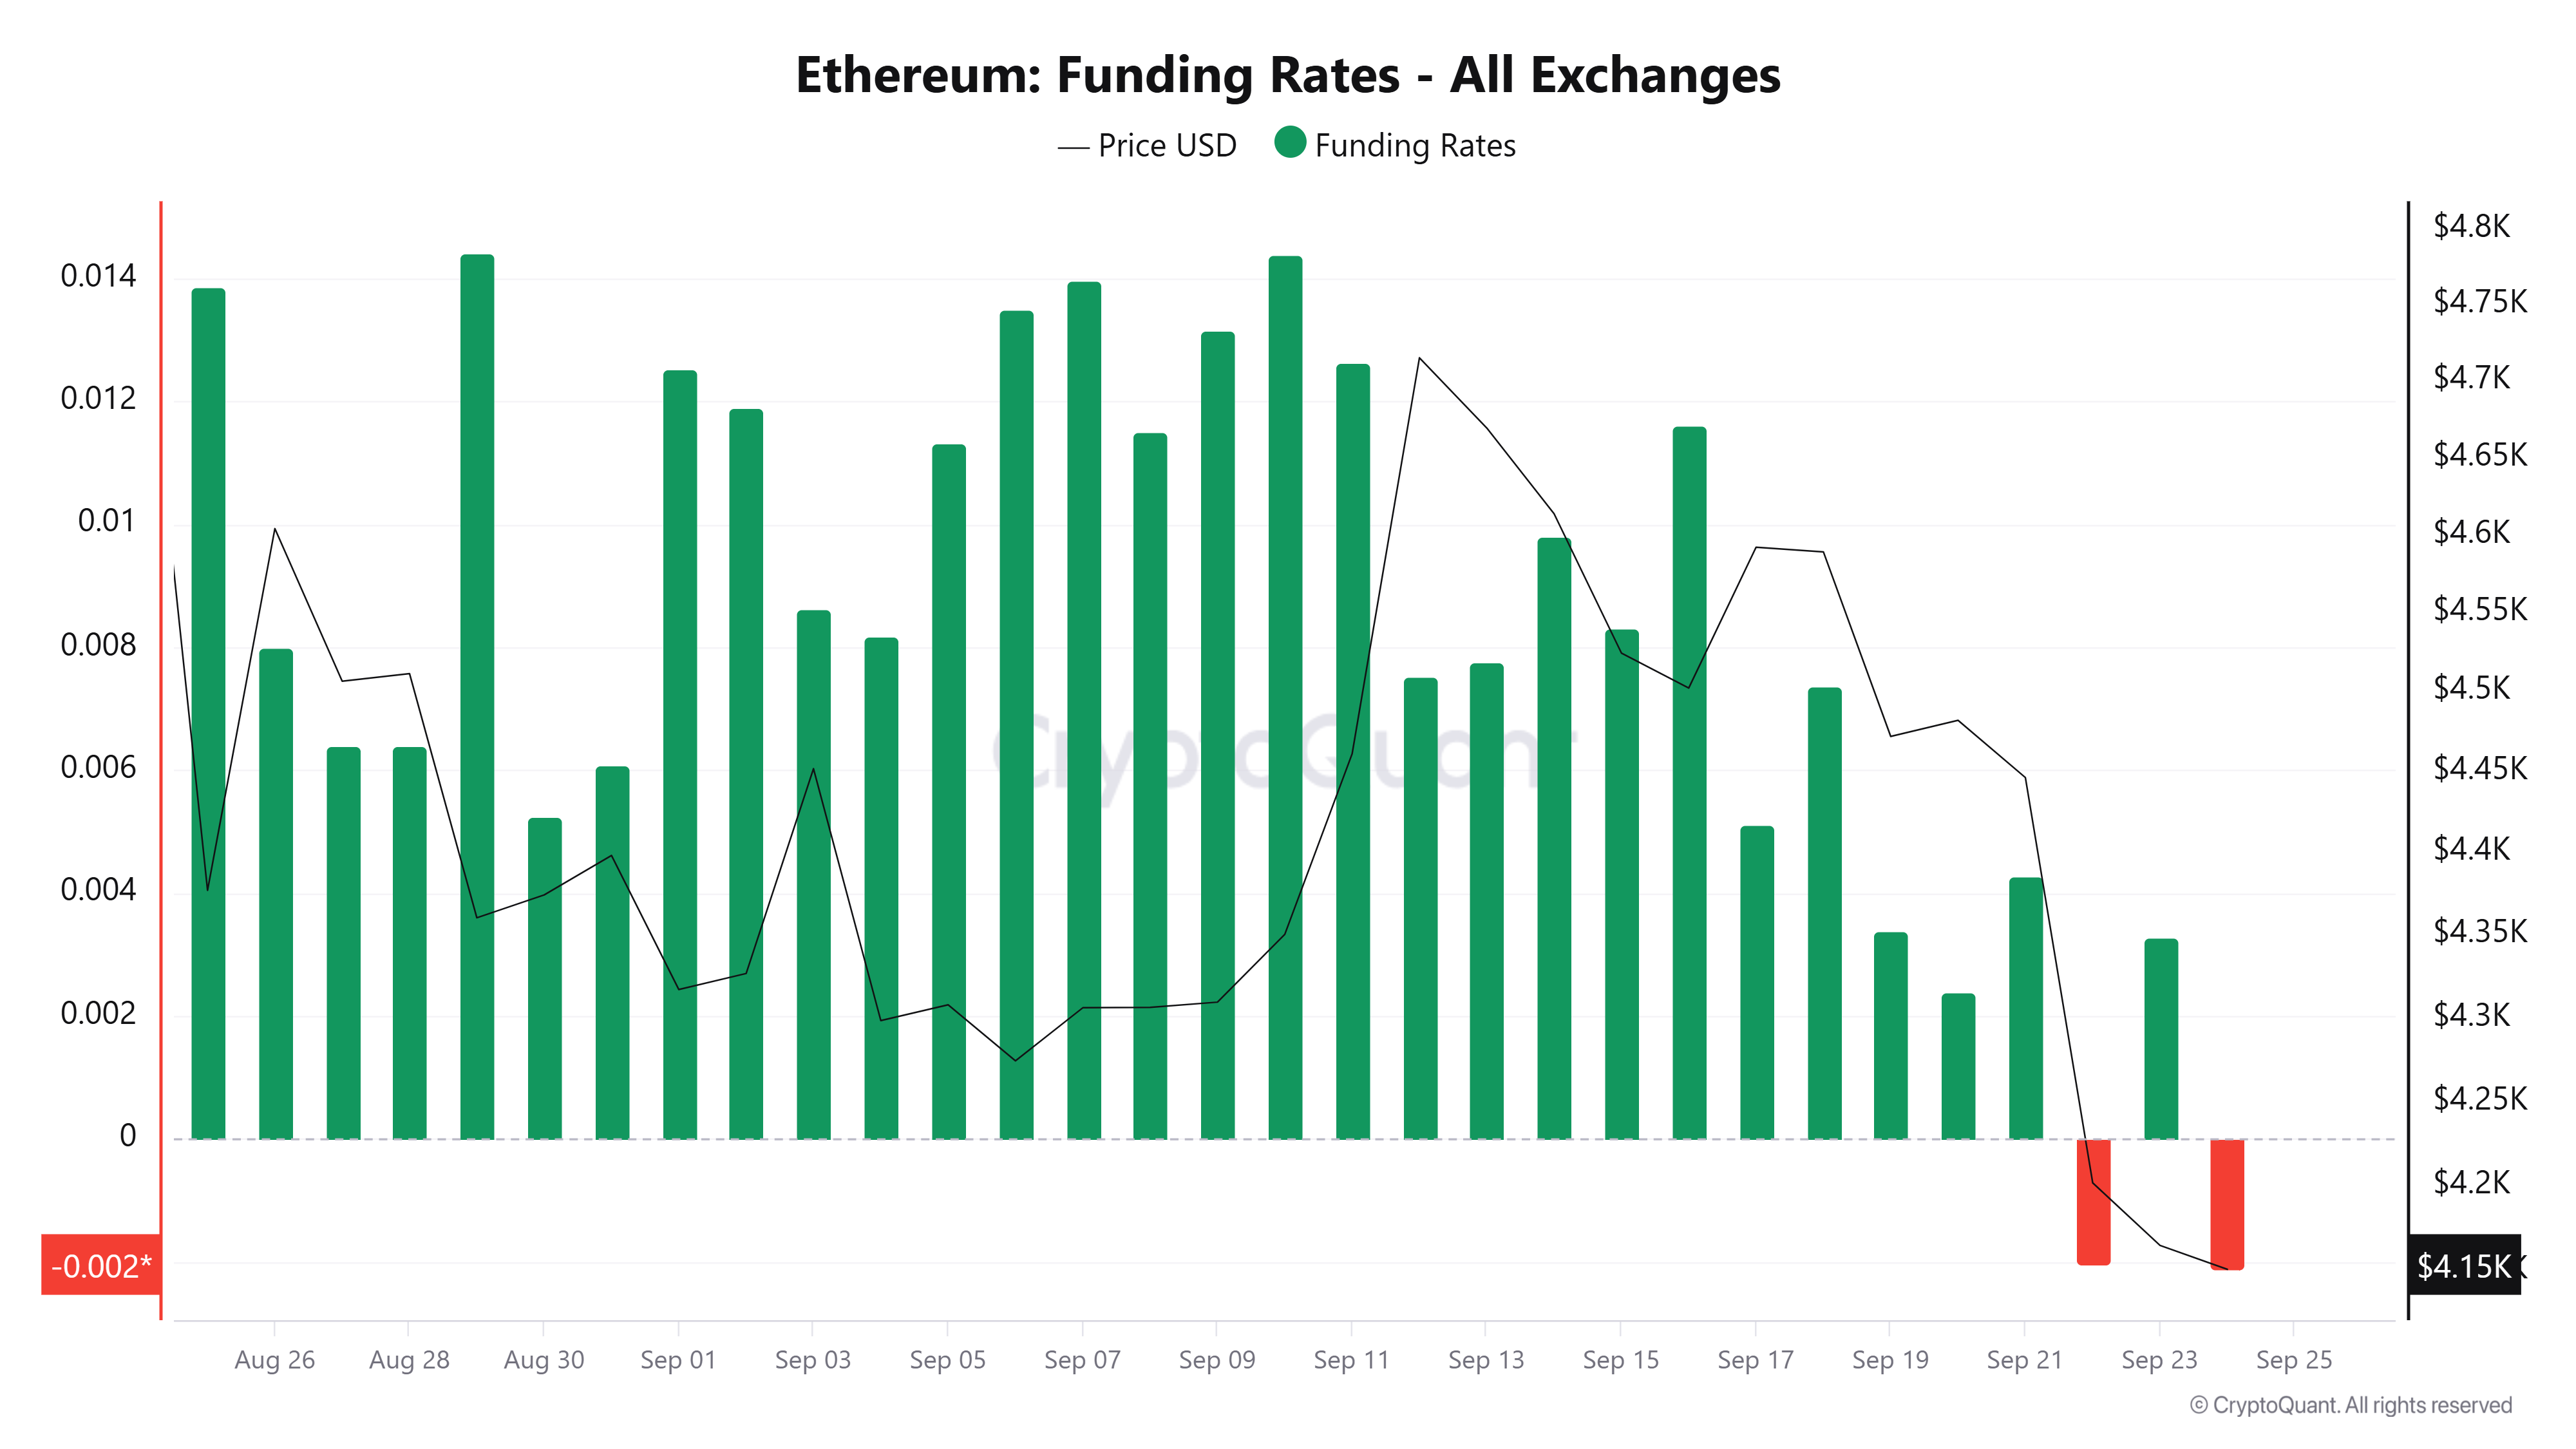
ETH Funding Rates. Source: CryptoQuant
Funding rates are periodic fees between perpetual futures traders, to keep a contract's price closely aligned to the spot price of the underlying asset it tracks. Negative funding rates occur when a contract trades below the spot price of its underlying asset, implying a dominant bearish sentiment as short position holders pay long position holders.
The steady decline in ETH funding rates over the past week suggests that bearish positioning is increasing among futures traders, a clear divergence from the market sentiments expressed in August. Historically, negative funding rates can either indicate a potential market bottom triggering a short squeeze or fuel a period of lagging prices.
A bearish sentiment is also evident in US spot Ethereum exchange-traded funds (ETFs), which have recorded two consecutive days of net outflows totalling $216.7 million, according to SoSoValue data. This suggests that institutional investors are also becoming cautious in the wake of the recent surge in leverage.
Corporate ETH treasuries, apart from BitMine Immersion (BMNR), have also seen very minimal action in the past few weeks, with no notable buy-side activity. However, BitMine's steady accumulation has managed to boost interest in ETH treasuries. The firm added over 264,000 ETH to its holdings last week.
Ethereum Price Forecast: ETH continues testing $4,000 support
Ethereum saw $62 million in futures liquidations over the past 24 hours, with long liquidations accounting for $38.9 million
ETH retested the support near the $4,000 psychological level as it continues trading below the 20-day and 50-day Simple Moving Averages (SMA). A decline below $4,000 could see the top altcoin bounce off the 100-day SMA around $3,700. However, a reclaim of the $4,500 level could push ETH to rest its all-time high resistance established on August 24.
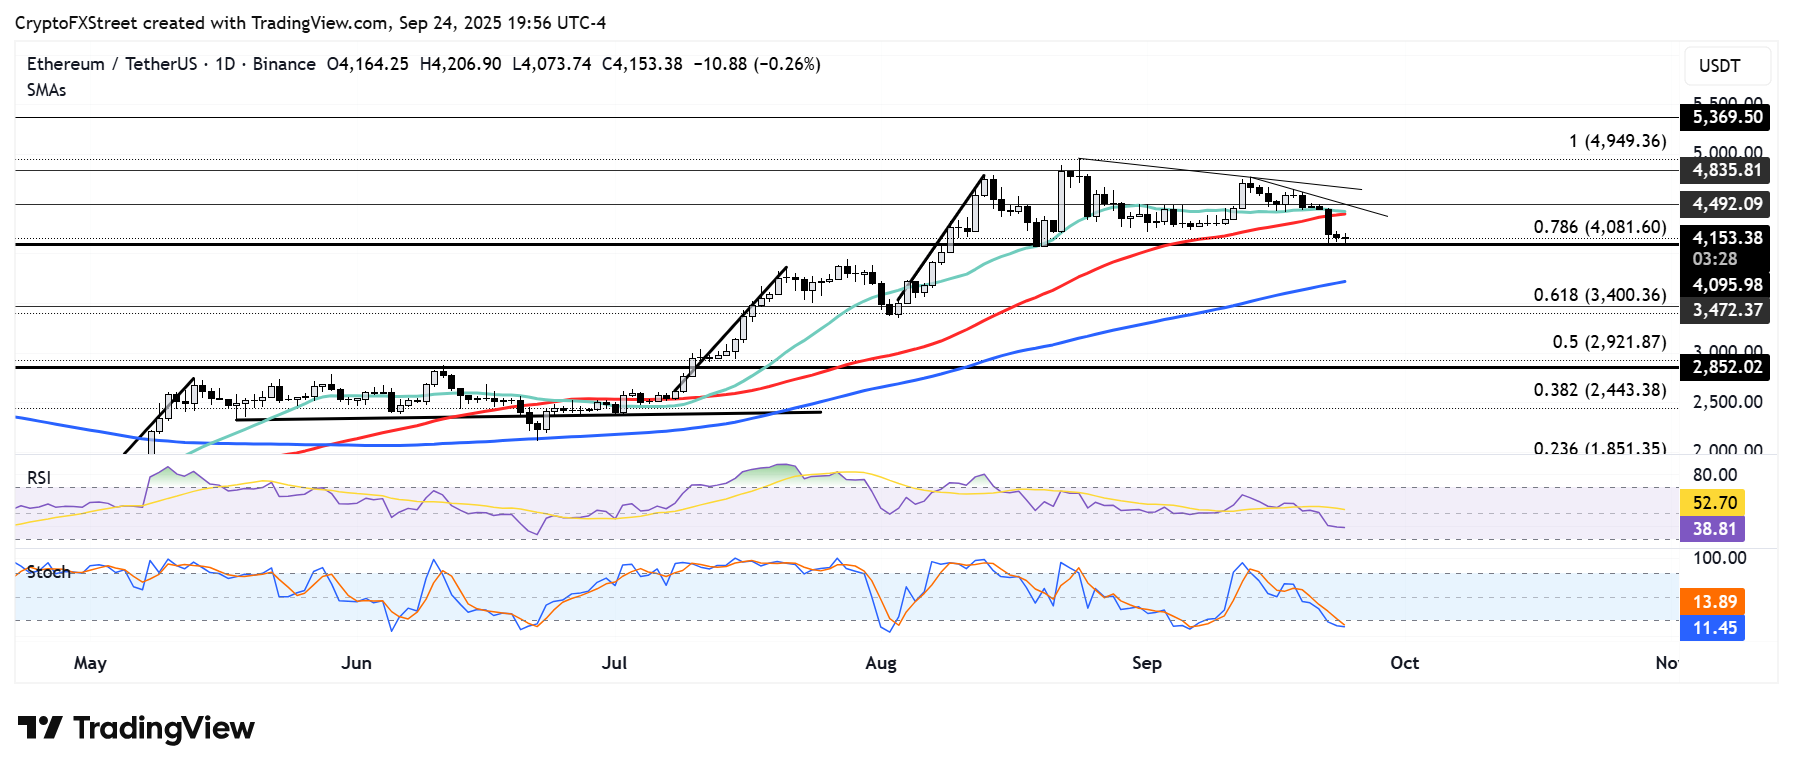
ETH/USDT daily chart
The Relative Strength Index (RSI) is below its neutral level while the Stochastic Oscillator (Stoch) has entered its oversold region, indicating a dominant bearish momentum.
You May Also Like

Will Bitcoin Soar or Stumble Next?

XRP Whales Offload 200 Million XRP as Market Pauses Near $3