XRP trades near $2.17, revisiting a key support zone seen before past rallies. Analysts watch for a breakout or further downside.XRP trades near $2.17, revisiting a key support zone seen before past rallies. Analysts watch for a breakout or further downside.

Ripple (XRP) Back at Key Level: Could History Repeat to New ATHs?

2025/11/08 03:01

Ripple’s XRP is trading near $2.17 at press time, following a weekly drop of over 13%. Despite recent selling pressure, the asset has returned to a zone that previously triggered a strong rally.

Analysts are watching to see if the current structure could support another major move.

Testing a Familiar Zone

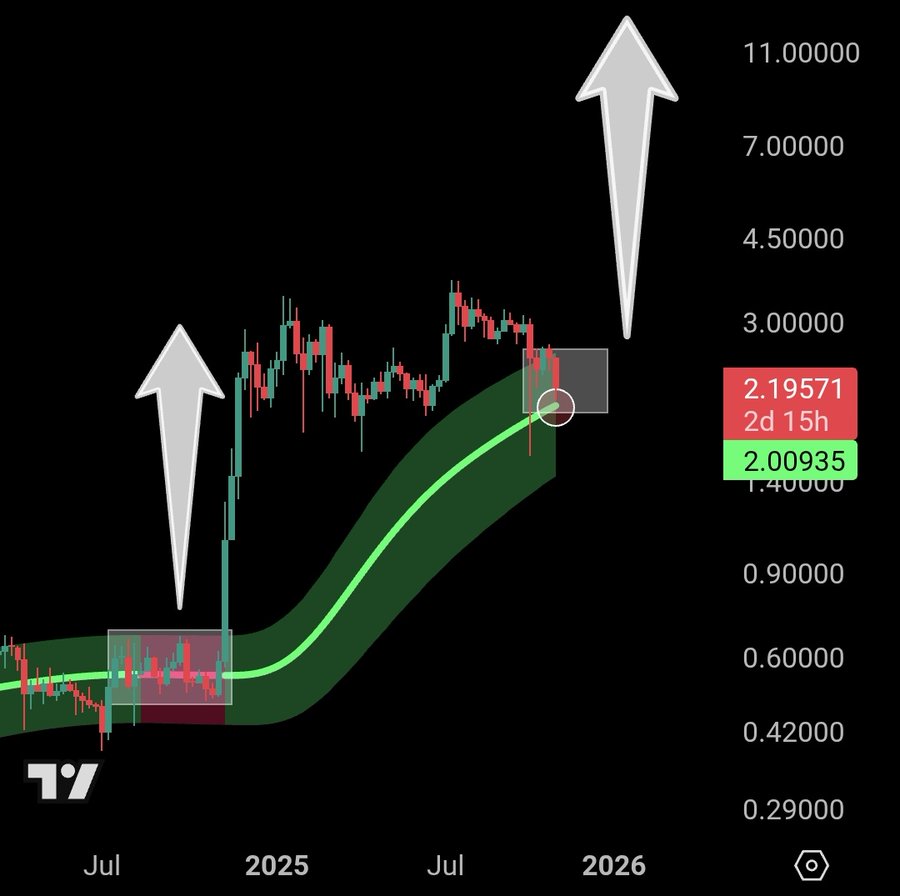
A chart shared by ChartNerd shows XRP touching the mid-regression band of the Growth Curve (GC). This same level acted as a base before the July 2024 breakout. The price now sits between $2.00 and $2.20—roughly the same range where the last rally began.

Notably, the chart outlines a possible repeat of that setup, showing a grey box that matches the prior consolidation. Long wicks on recent candles may suggest buyers are stepping in near the lower end of the range. ChartNerd commented that this zone “could be our foundational base,” but price stability is still needed.

XRP price chartSource: ChartNerd/X

Moreover, analyst EtherNasyonaL posted a monthly chart showing XRP trading within a clear range. The support level is marked around $1.99, and resistance sits near $3.31. The structure has held for several months, with the price continuing to move sideways.

The analyst described this as a re-accumulation phase. The setup remains valid as long as the asset stays between these levels.

A break above $3.31 would mark a shift in trend, while a drop below $1.99 could reset expectations.

Short-Term Charts Show Uncertainty

CryptoWZRD posted a bearish daily outlook, noting that both XRP and XRPBTC closed weak. The next resistance is at $2.75, with $2.00 acting as key support. A breakout above the daily high may open the way toward $3.65, but for now, the chart leans bearish.

On shorter timeframes, the price action has been choppy. A decisive drop below $2.30 may trigger a short setup, while a move above $2.55 could lead to upside. The analyst added that they are “waiting for a more mature chart formation” to take action.

On-Chain Activity and Wallet Growth

CryptoQuant market technician CryptoOnchain reported that large XRP holders have been sending coins to exchanges. This move is often linked with profit-taking or exits, especially during price jumps. The analyst described it as a classic “sell the news” setup.

Despite the pullback, 21,595 new XRP wallets were created in just two days—the largest spike in eight months, as CryptoPotato reported.

The post Ripple (XRP) Back at Key Level: Could History Repeat to New ATHs? appeared first on CryptoPotato.

Disclaimer: The articles reposted on this site are sourced from public platforms and are provided for informational purposes only. They do not necessarily reflect the views of MEXC. All rights remain with the original authors. If you believe any content infringes on third-party rights, please contact service@support.mexc.com for removal. MEXC makes no guarantees regarding the accuracy, completeness, or timeliness of the content and is not responsible for any actions taken based on the information provided. The content does not constitute financial, legal, or other professional advice, nor should it be considered a recommendation or endorsement by MEXC.

You May Also Like

1011 Flash Crash and Stream Default: Unveiling the Root Causes of the Rapidly Deteriorating Sentiment in the Crypto Market

1011 Flash Crash and Stream Default: Unveiling the Root Causes of the Rapidly Deteriorating Sentiment in the Crypto Market

Original title: Why Did Crypto Sentiment Get So Bearish? Original author: Jack Inabinet, Bankless Compiled by: Peggy, BlockBeats Editor's Note: Just four days after Bitcoin hit a record high, the crypto market experienced an unprecedented "10/10 flash crash," with major cryptocurrencies plummeting, numerous altcoins going to zero, and exchanges facing liquidation crises. Simultaneously, highly leveraged funds like Stream Finance collapsed, revealing the fragile nature of "trust me and you're good to go" bubbles. Optimism on social media quickly turned into panic, severely damaging market confidence. This article reviews the ins and outs of this series of events, attempting to answer a key question: Why has the sentiment in the crypto market suddenly become so pessimistic? In the current context of a bursting bubble and a crisis of trust, we may be standing at a new turning point in the cycle. The following is the original text: On Monday, October 6, 2025, Bitcoin hit a new record high, breaking the $126,000 mark for the first time. Whether in the trenches of Crypto Twitter or in the newsroom of CNBC, holders were immersed in an omnipresent "fog of hope". Although the fundamentals did not change much in the month that followed, just four days later on October 10, the crypto market was hit by a crisis – the “10/10 flash crash” is now considered the largest liquidation event in crypto history. In this catastrophic crash, major cryptocurrencies plummeted by more than double digits, many altcoins went to zero, and several exchanges were on the verge of bankruptcy (almost all major perpetual contract platforms triggered automatic liquidation mechanisms because they were unable to pay short positions). Despite the fact that Trump's election was seen as a boon to the crypto industry—from establishing a strategic Bitcoin reserve to appointing regulators who appeared to be pro-crypto—the price of crypto assets has remained sluggish. Aside from a brief surge following Trump's election last November, the ratio of the total market capitalization of cryptocurrencies to the S&P 500 has remained relatively stable for nearly a year. In fact, since Trump's inauguration on January 20, this ratio has even experienced a surprising negative growth. As the market continues to digest the aftermath of the 10/10 liquidation, more and more questions are beginning to surface. Just this Monday, Stream Finance declared bankruptcy. This was a "trust me" crypto income fund managing $200 million, relying on leverage to provide depositors with above-market returns. Its "external fund manager" lost approximately $93 million in assets during operations. While details have not yet been disclosed, Stream is likely the first "Delta-neutral" strategy fund to publicly collapse due to its 10/10 automatic liquidation mechanism. Although its structure had already raised questions, this collapse still caught many lenders off guard—they chose to sacrifice safety for higher returns without clear risk signals. After Stream collapsed, panic quickly spread throughout the DeFi ecosystem, and investors began to collectively withdraw from similar high-risk, high-return strategies. Although the ripple effects of Stream have not yet fully spread, this incident has exposed the risks of the increasingly popular "cyclic stablecoin mining" strategy in DeFi—that is, using existing high-risk deposit certificates to leverage and obtain higher returns. Stream's self-reported losses also reveal the potentially huge losses that Delta-neutral funds may have encountered during the 10/10 automatic position reduction: short hedging was forcibly canceled by the system, and spot long positions instantly went to zero. Although the headlines have shifted, it is certain that the losses on October 10th were catastrophic. Whether operating openly through DeFi or covertly through CeFi, crypto yield funds involve billions of dollars in leverage. Whether the market has sufficient liquidity to cope with potential future liquidations remains to be seen. It's unclear who's "swimming naked," but it's certain that some in the crypto casinos are already out of the loop. If the market falls again, especially after lawsuits alleging centralized exchanges were insolvent during the 10/10 liquidation period, the question won't be "whether something will happen," but rather "whether the entire industry can withstand it."
Share
PANews2025/11/08 07:30
COIN & HOOD drop over 10% – THREE signs crypto market could follow

COIN & HOOD drop over 10% – THREE signs crypto market could follow

The post COIN & HOOD drop over 10% – THREE signs crypto market could follow appeared on BitcoinEthereumNews.com. Key Takeaways Why are COIN and HOOD dropping sharply? COIN and HOOD are feeling the high-beta impact of a broader risk-off, with selling across exchanges and miners amplifying pressure. Is the market signaling a deeper downturn? BTC’s fragile $100k support, skewed order books, and $144 billion in OI suggest liquidation risk, reflecting fragility rather than confirmed bottoms. The broader risk-off is bleeding into crypto-linked stocks. While pressure is coming from across the market, including miner stocks like Marathon Digital Holdings (NASDAQ: MARA), which fell 7% to a two-month low, at press time, a deeper sell-off is hitting exchange-based crypto stocks. Robinhood (NASDAQ: HOOD) has dropped 11% intraday to $127, a sharper decline than its mid-October crash, which was triggered by crypto volatility and platform slowdowns. Source: TradingView (HOOD/USD) Coinbase (NASDAQ: COIN) mirrored the trend, plunging 15% after the crash to a monthly low of $310. Overall, the sell-off in crypto-related stocks signals a broader market shakeout, with pressure spreading across major trading platforms. In this context, what do COIN’s 7.57% intraday dip, HOOD’s 11% drop, and weakness in other crypto equities indicate? Is the market bracing for another October-style cascade, or is this just a temporary technical blip? COIN, HOOD order books reveal flow imbalance The market’s at a crossroads, with key support levels hanging by a thread.  That said, exchange orderbooks are giving clues. On Coinbase, Bitcoin’s [BTC] bid-depth (+2%) sat at $9 million, while the ask-depth (-2%) towered at $26 million, at press time, signaling that sellers are dominating near-term flows. Against this backdrop, BTC’s $100k level looks extremely vulnerable. As a result, another liquidation cascade can’t be ruled out, with $144 billion in “market-side” Open Interest (OI) at risk of getting squeezed.  Source: Coinglass In short, COIN and HOOD’s intraday dips are echoing this high-beta setup. As…
Share
BitcoinEthereumNews2025/11/08 07:28