XRP rose 7% to $2.60 as volume increased 17%, with chart patterns pointing to possible long-term targets of $14 and $28.XRP rose 7% to $2.60 as volume increased 17%, with chart patterns pointing to possible long-term targets of $14 and $28.

XRP Reclaims Key Trendline: $14 to $28 Projections Ahead

2025/10/13 17:17

XRP jumped over 7% in the past 24 hours, recovering from last week’s sharp drop. The asset moved from $2.37 to $2.59, adding roughly $30 billion to its market value.

Meanwhile, trading volume rose 17% to $9.6 billion as large buyers stepped in following a tariff-driven selloff.

Long-Term Pattern Suggests Higher Targets

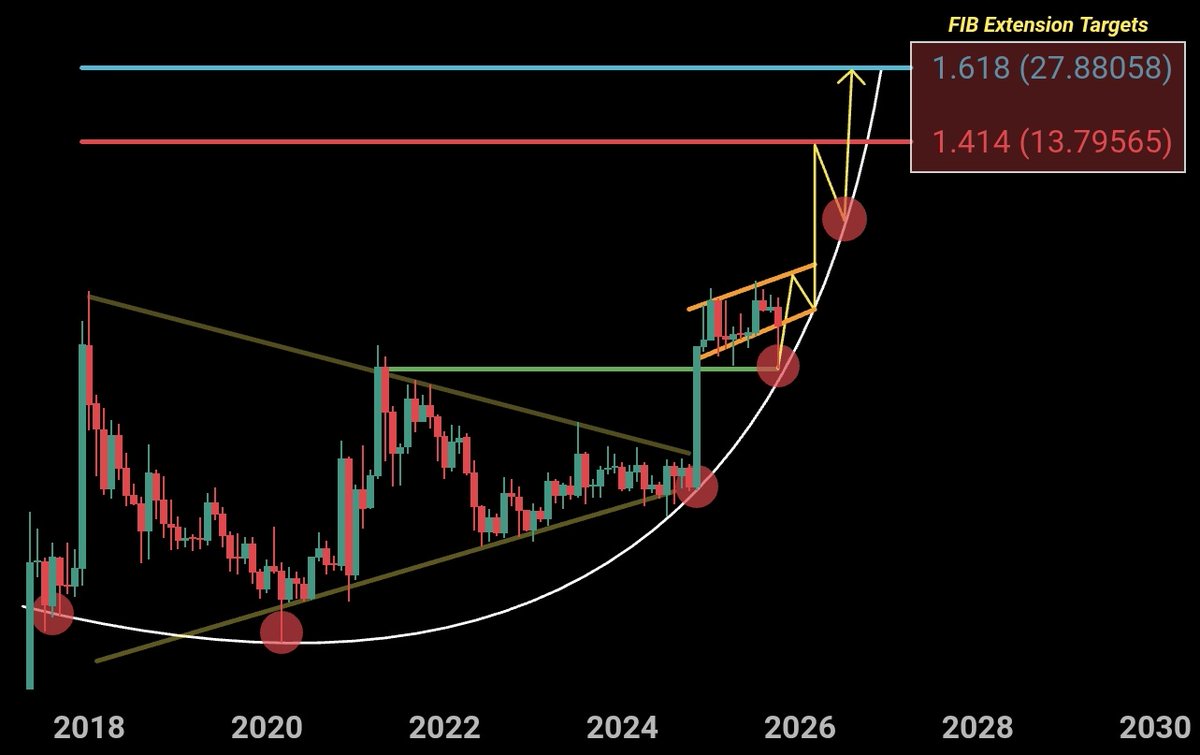
A chart shared by ChartNerd shows XRP breaking out of a multi-year triangle pattern, which began forming in 2018 and saw a clean breakout in late 2023. Since then, Ripple’s token has followed a curved support path, which has held across several key price levels.

Based on this structure, price projections are placed at $14 and $28. These targets come from commonly used Fibonacci extension levels (1.414 and 1.618).
XRP price chartSource: ChartNerd/X

Notably, the chart also shows a flag forming in 2024–2025, which often acts as a pause before a trend continues. If the price moves above this flag, the path toward the higher targets could open up between 2026 and 2028.

Weekly Close Holds Above Trendline

XRP ended last week above a key rising trendline that has been in place since late 2024. This line has acted as support through several price swings.

CryptoBull commented,

The long lower wick on the candle suggests that buyers stepped in quickly after the drop. The strong bounce back and a rise in trading volume point to a possible shift in momentum.

Short-Term Chart Still Faces Resistance

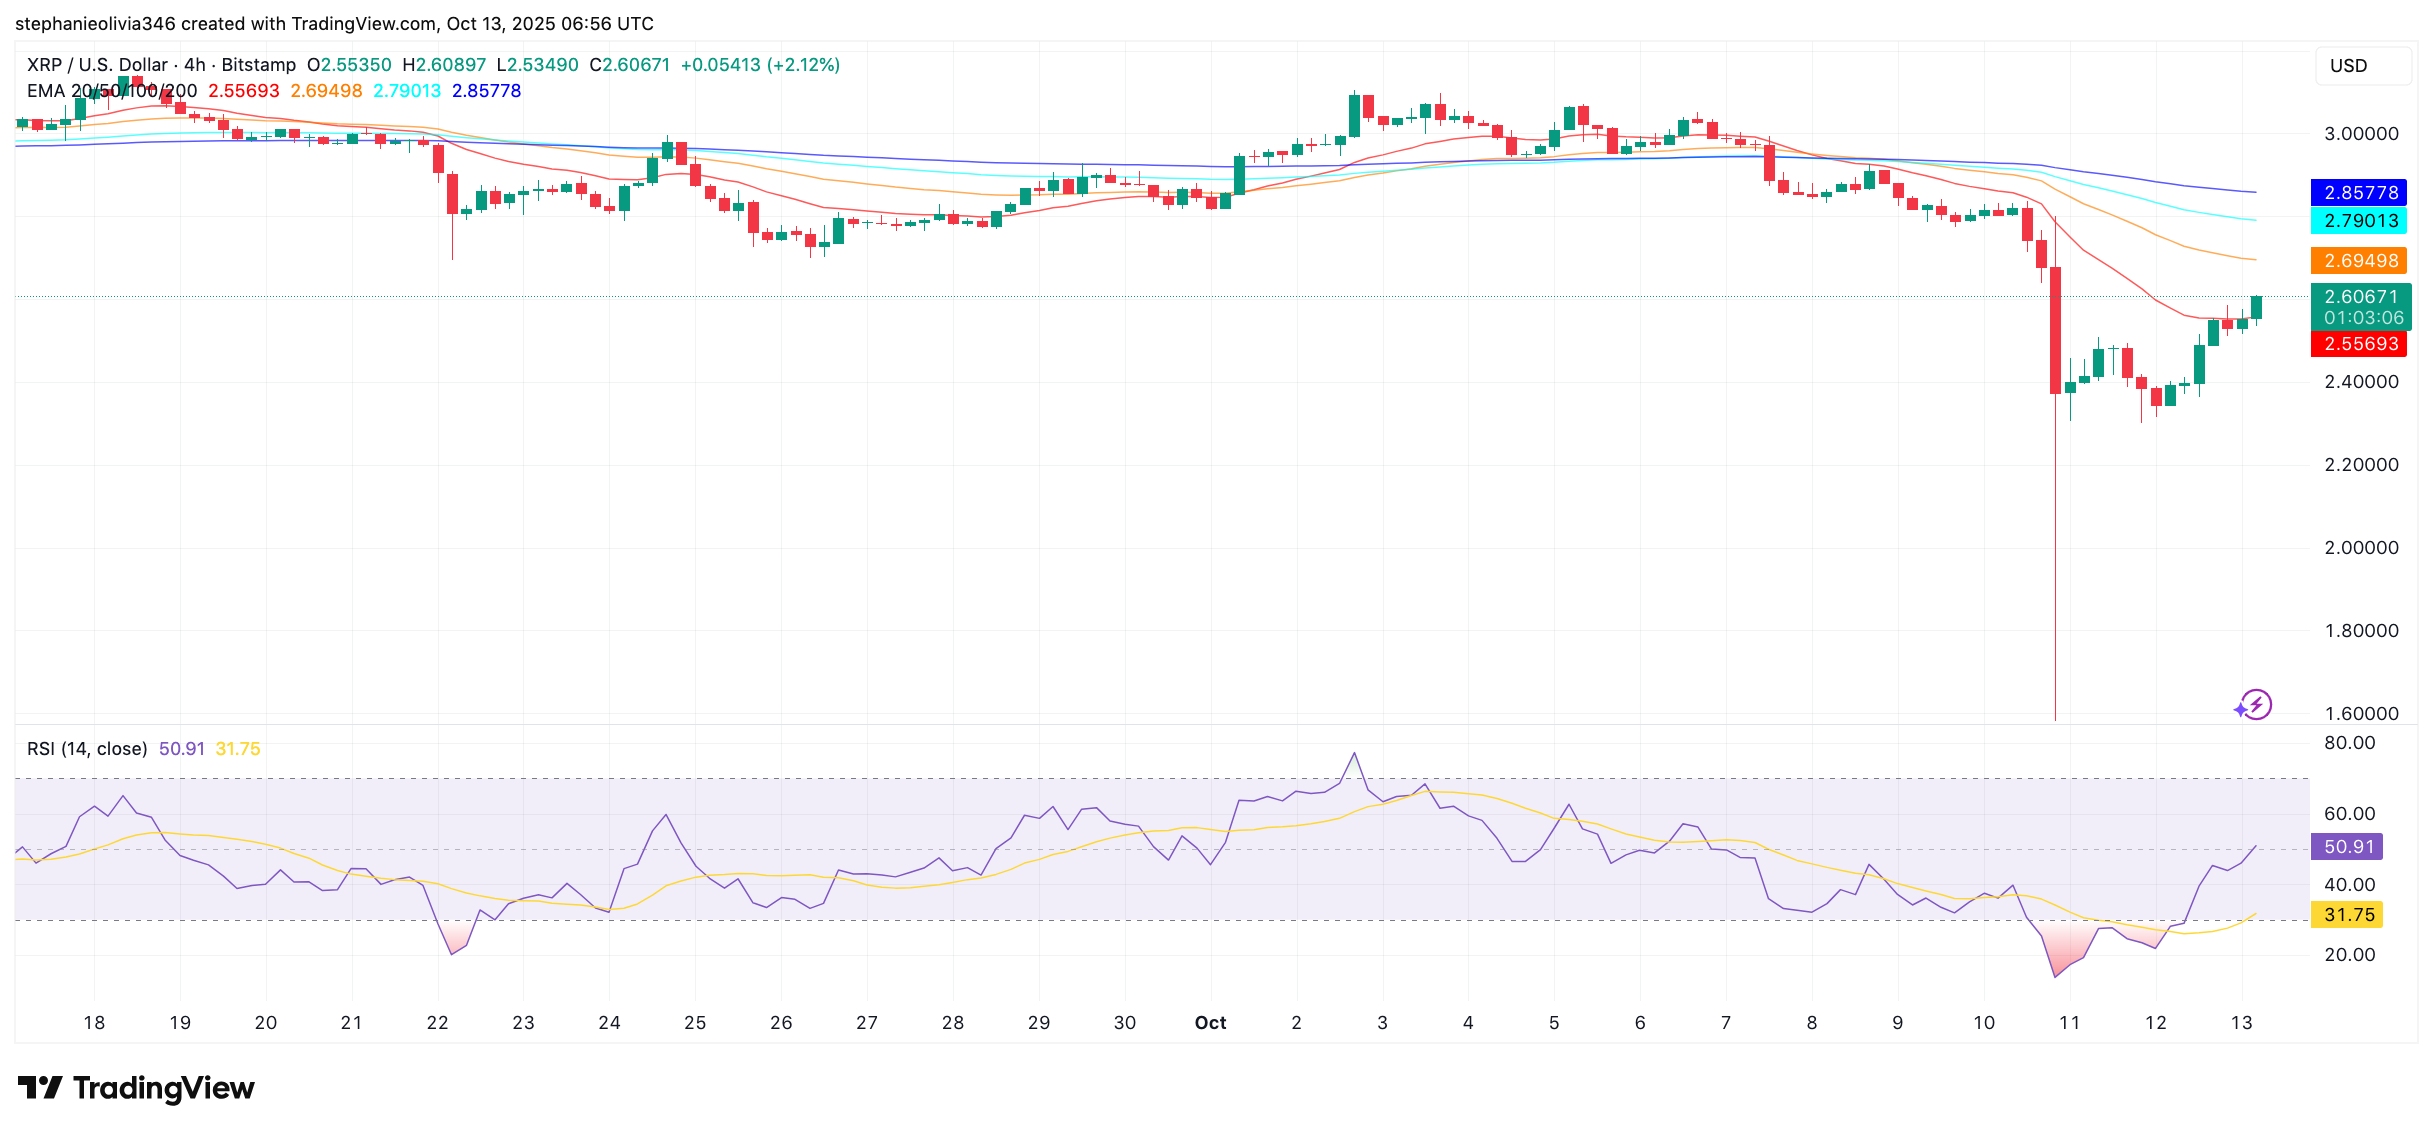
On the 4-hour chart, XRP has moved back above the 20 EMA, now sitting at $2.56. This shows early signs of strength after the recent selloff. The asset is now holding at around $2.60.

However, XRP still trades below the 50 EMA ($2.69), 100 EMA ($2.79), and 200 EMA ($2.86). These moving averages are often seen as short-term resistance. A clear move above them would signal a stronger recovery. Until that happens, caution remains in place.
XRP price chartSource: TradingView

The Relative Strength Index (RSI) is presently near the 51 mark, which is an increase from a value below 30 given two days ago. The momentum is getting better as indicated by a value above 50.

The price staying above $2.60 has resulted in this bounce back of the RSI. In case XRP breaks resistance in the near future, the RSI might keep going up. For now, the trend is still unclear; however, the fast recovery has made the asset noticeable again.

The post XRP Reclaims Key Trendline: $14 to $28 Projections Ahead appeared first on CryptoPotato.

Disclaimer: The articles reposted on this site are sourced from public platforms and are provided for informational purposes only. They do not necessarily reflect the views of MEXC. All rights remain with the original authors. If you believe any content infringes on third-party rights, please contact service@support.mexc.com for removal. MEXC makes no guarantees regarding the accuracy, completeness, or timeliness of the content and is not responsible for any actions taken based on the information provided. The content does not constitute financial, legal, or other professional advice, nor should it be considered a recommendation or endorsement by MEXC.
Share Insights

You May Also Like

Edges higher ahead of BoC-Fed policy outcome

Edges higher ahead of BoC-Fed policy outcome

The post Edges higher ahead of BoC-Fed policy outcome appeared on BitcoinEthereumNews.com. USD/CAD gains marginally to near 1.3760 ahead of monetary policy announcements by the Fed and the BoC. Both the Fed and the BoC are expected to lower interest rates. USD/CAD forms a Head and Shoulder chart pattern. The USD/CAD pair ticks up to near 1.3760 during the late European session on Wednesday. The Loonie pair gains marginally ahead of monetary policy outcomes by the Bank of Canada (BoC) and the Federal Reserve (Fed) during New York trading hours. Both the BoC and the Fed are expected to cut interest rates amid mounting labor market conditions in their respective economies. Inflationary pressures in the Canadian economy have cooled down, emerging as another reason behind the BoC’s dovish expectations. However, the Fed is expected to start the monetary-easing campaign despite the United States (US) inflation remaining higher. Investors will closely monitor press conferences from both Fed Chair Jerome Powell and BoC Governor Tiff Macklem to get cues about whether there will be more interest rate cuts in the remainder of the year. According to analysts from Barclays, the Fed’s latest median projections for interest rates are likely to call for three interest rate cuts by 2025. Ahead of the Fed’s monetary policy, the US Dollar Index (DXY), which tracks the Greenback’s value against six major currencies, holds onto Tuesday’s losses near 96.60. USD/CAD forms a Head and Shoulder chart pattern, which indicates a bearish reversal. The neckline of the above-mentioned chart pattern is plotted near 1.3715. The near-term trend of the pair remains bearish as it stays below the 20-day Exponential Moving Average (EMA), which trades around 1.3800. The 14-day Relative Strength Index (RSI) slides to near 40.00. A fresh bearish momentum would emerge if the RSI falls below that level. Going forward, the asset could slide towards the round level of…
Share
BitcoinEthereumNews2025/09/18 01:23
Share