

Bitcoin Nears $70K as Seller Resistance Builds
Bitcoin is struggling to break through $70,000, and on-chain data points to a specific group of holders creating a wall of sell pressure that keeps capping every rally attempt.
Why Bitcoin Keeps Stalling Near $70K
The resistance isn’t random. A Glassnode report identified the 1-week to 1-month (1W-1M) holder cohort as the group responsible for the supply overhang near $70,000. These are investors who bought Bitcoin within the past week to 30 days, and their average cost basis sits right around that level.
That cost basis creates a resistance and distribution zone between roughly $68,500 and $71,500. Many of these recent buyers are underwater or barely breaking even, so when the price approaches their purchase level they sell to recover losses or lock in small gains.
The result is a ceiling. Each time Bitcoin rallies into that band, fresh supply from this group floods the market and pushes prices back down. Bitcoin has not produced a daily close above $70,000 since early February, reinforcing the zone as a meaningful near-term barrier.
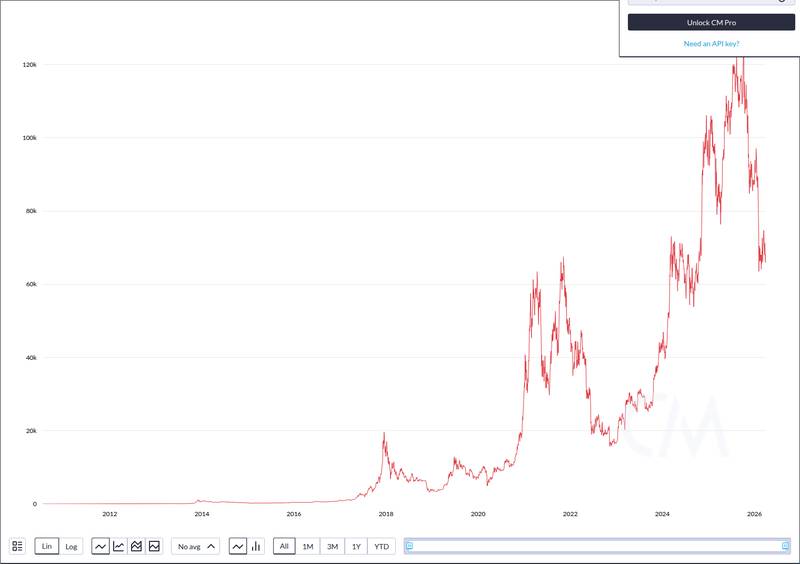 CoinMetrics blockchain-data panel highlighting the structural trend discussed for bitcoin.
What the Latest Market Data Says About Demand
Bitcoin traded at $66,938 at press time, down 2.61% over the past 24 hours. The pullback came even as the broader market waited for a catalyst strong enough to absorb the overhead supply.
Profit-taking momentum has collapsed. Glassnode noted the 30-day simple moving average of realized profit fell from above $1 billion per day to about $370 million per day, a decline of roughly 63%. Realized profit measures the value holders lock in when they move coins at a gain, so the sharp drop signals that fewer participants are willing to sell into strength.
Only about 57% of Bitcoin’s total supply is currently in profit, below the minus-one standard-deviation threshold near 60%. When that large a share of holders is underwater, rallies tend to meet resistance as those holders look to exit at breakeven rather than hold for further upside. Security concerns across the broader crypto ecosystem, highlighted by incidents like the $280 million Drift hack tied to North Korea suspects, have added to the cautious mood.
Sentiment reflects that caution. The Fear and Greed Index read 12 at press time, classified as Extreme Fear. The market is far from euphoric, even as Bitcoin attempts to rebuild toward $70,000. In a separate but related development, Moody’s recently proposed a Bitcoin haircut framework that could act as a forced-selling trigger, adding another layer of risk for institutional holders.
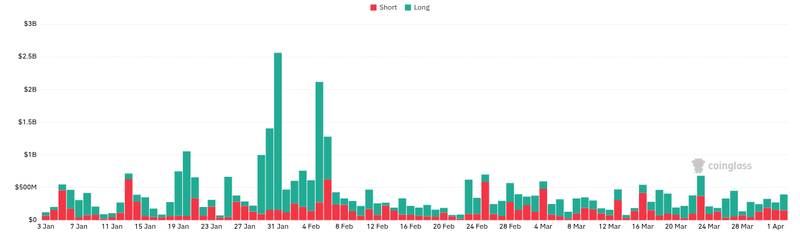 CoinGlass derivatives data capture supporting the futures-and-liquidations angle for bitcoin.
What Bitcoin Holders Should Watch Next
For Bitcoin to break cleanly above $70,000, demand needs to be strong enough to absorb the supply that 1W-1M holders are distributing in the $68,500 to $71,500 zone. Until buyers outpace that selling, the price is likely to keep bouncing between $60,000 and $70,000.
One potential source of renewed demand is U.S. spot Bitcoin ETFs. Glassnode noted that ETF flows have started to stabilize after a stretch of outflows earlier this year. Stabilization is not the same as aggressive buying, but it removes one source of downward pressure. Questions around whether better security infrastructure could have prevented recent high-profile hacks continue to shape institutional risk appetite as well.
The practical takeaway: the $68,500 to $71,500 zone is the level to watch. A sustained daily close above $71,500 would signal that the seller overhang has been absorbed, while continued rejections near $70,000 would reinforce the current range. With sentiment deep in Extreme Fear and realized-profit momentum still declining, the burden of proof sits with buyers.
Disclaimer: This article is for informational purposes only and does not constitute financial or investment advice. Cryptocurrency and digital asset markets carry significant risk. Always do your own research before making decisions.


Ayrıca Şunları da Beğenebilirsiniz

Surplus seen narrowing on external risks – UOB

Oil Surges Above $110 as War Fears Shake Markets


