

Bitcoin Washout Points To $180,000 In 90 Days, GMI Says
Global Macro Investor (GMI) head of macro research Julien Bittel posted a bitcoin “oversold RSI” roadmap on X, arguing the market has tracked it closely and tying the setup to a broader view that the cycle could run into 2026—an outlook he says would render the traditional “four-year cycle” framework obsolete.
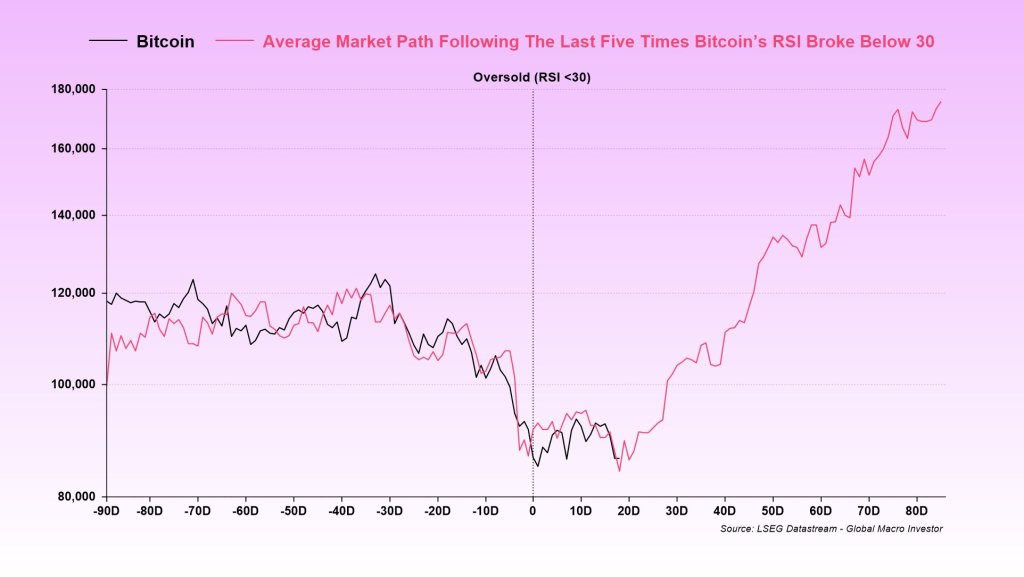
“A lot of people have been asking for an update on this chart, so I’ll just leave this here for anyone who needs to see it,” Bittel wrote, sharing a chart of bitcoin’s average price path after RSI falls below 30, with the RSI breach marked as t=0. “This shows the average BTC trajectory following an oversold RSI reading, with RSI falling below 30 at t=0.”
Can Bitcoin Skyrocket To $180,000 In Just 90 Days?
Bittel said the overlay has matched the current tape. “So far, it’s been pretty bang on,” he wrote. The “average market path” line rises sharply over the weeks that follow. The chart shows a steep rally within 90 days after t=0, with the BTC price potentially surging near the $180,000 area.
Still, Bittel emphasized the chart is not meant to be a precision forecast. “No, it won’t be perfect,” he wrote, adding that “assuming the bull market isn’t already over, it’s a useful chart to keep in mind.” He also warned that the rebound process can be uneven: “bases can take time to form and usually come with plenty of chop before the bigger up-move kicks in.”
He reiterated the conditional nature of the framework in blunt terms. “If you think the bull market is over and we are now facing twelve months of pain, this chart is not for you. Move along…”
The bigger point, Bittel said, is that the familiar cycle narrative should not be taken for granted. “Unless you believe the 4-year cycle is still in play, which we don’t, this chart should hold up contextually over time,” he wrote. “As we’ve outlined many times, based on our work on the business cycle, the current path of financial conditions, and our expectations for overall liquidity, the balance of probabilities is that this cycle extends well into 2026.” In that scenario, he added, “the 4-year cycle is dead.”
Bittel also challenged the common assumption that bitcoin’s rhythm is fundamentally “about the halving.” “Remember, the 4-year cycle was never about the halving, despite widespread belief that it is, but instead has always been driven by the public debt refinancing cycle,” he wrote, adding that post-COVID that dynamic “was pushed out by one year.” He now argues the cycle is “officially broken” because “the weighted average maturity of the debt term structure has increased.”
He framed the macro backdrop in terms of debt-service pressure and liquidity response. “The bigger picture is that there is still a vast amount of interest expense that needs to be monetized, which has far exceeded GDP growth,” Bittel wrote.
Reactions across crypto X ranged from enthusiastic to skeptical. The ₿itcoin Therapist replied: “$180,000 BTC in 90 days.”
LondonCryptoClub (@LDNCryptoClub) said the chart “lines up with our thinking,” tying the narrative to what it called the Fed’s “not QE QE” dynamics and “liquidity games” between the Treasury and the central bank. The account still anticipated turbulence into year-end—“noise and chop into year end (which is negative liquidity)”—before “these fundamental drivers start to see BTC reconnect with the bull trend,” adding that “sentiment appears sufficiently bad for a BTC move higher to be the most hated trade to start 2026!”
Others struck a more sardonic tone. “precision-grade hopium here,” wrote doug funnie (@cryptoklotz), while still sketching a conditional path forward: Still think as long as BTC survives (ie doesn’t close in the $70k’s and starts grinding down or accepting there), there’s a plausible path to new highs on the earlier side in 2026. Just need to survive the ‘transition zone’ of 4 year deterministic selloors exhausting, and then ending up in an awkward spot as the music keeps playing.”
Capriole Investments founder Charles Edwards was more critical of the statistical grounding, urging a broader test set: “Now re run this with 100 occurrences, not 5 during up only.”
For traders, Bittel’s post effectively combines a tactical signal with a regime call: the RSI sub-30 template may map the rebound path, but only “assuming the bull market isn’t already over,” and only in a world where, as he put it, “the balance of probabilities” favors a cycle that “extends well into 2026.”
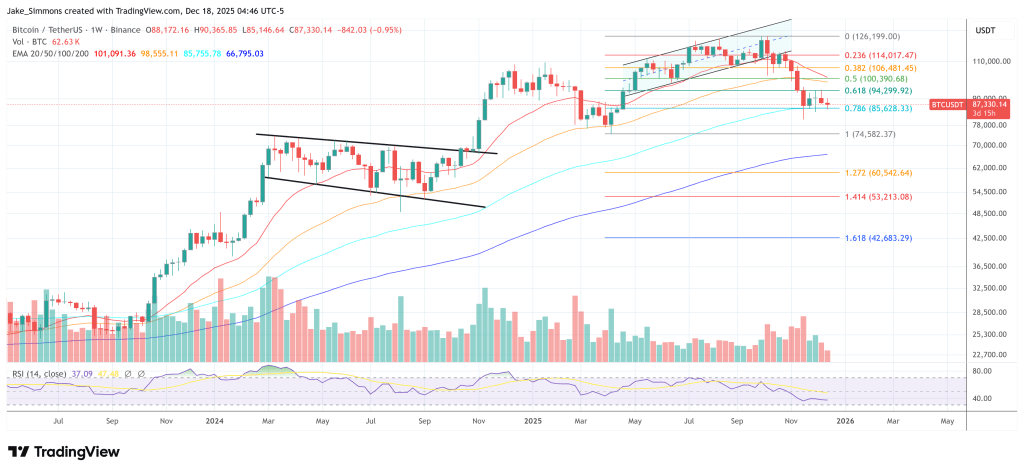
At press time, BTC traded at $87,330.
Ayrıca Şunları da Beğenebilirsiniz

Zycus Launches Industry-First AI Adoption Index to Measure Real-World AI Maturity in Procurement

Soccer Replica Jerseys – Kits, Customization, and Best Practices for Caring for Them
