

Solana (SOL) Cracks Lower, Traders Brace for Volatile Selloff
Solana failed to settle above $85 and extended losses. SOL price is now consolidating losses below $80 and might struggle to start a recovery wave.
- SOL price started a fresh decline below $88 and $85 against the US Dollar.
- The price is now trading below $86 and the 100-hourly simple moving average.
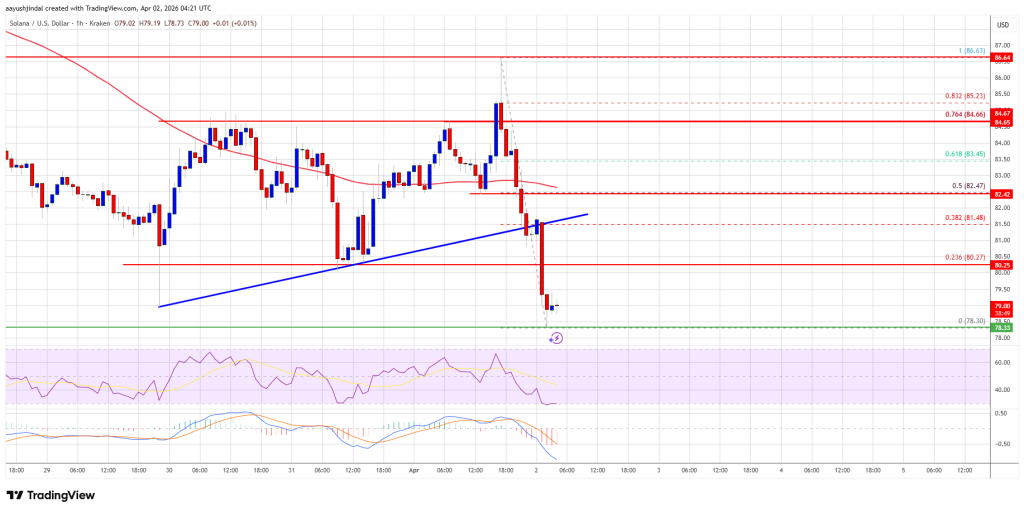
- There was a break below a bullish trend line with support at $81.50 on the hourly chart of the SOL/USD pair (data source from Kraken).
- The price could start a recovery wave if the bulls defend $78 or $75.
Solana Price Dips Below $85
Solana price failed to remain stable above $85 and started a fresh decline, like Bitcoin and Ethereum. SOL declined below the $82 and $80 levels.
There was a break below a bullish trend line with support at $81.50 on the hourly chart of the SOL/USD pair. The bears even pushed the price toward $78. A low was formed at $78.30, and the price is now consolidating losses below the 23.6% Fib retracement level of the downward move from the $86.63 swing high to the $78.30 low.
Solana is now trading below $86 and the 100-hourly simple moving average. On the upside, immediate resistance is near the $80.25 level. The next major resistance is near the $82.50 level or the 50% Fib retracement level of the downward move from the $86.63 swing high to the $78.30 low.
The main resistance could be $85. A successful close above the $85 resistance zone could set the pace for another steady increase. The next key resistance is $88. Any more gains might send the price toward the $92 level.
More Losses In SOL?
If SOL fails to rise above the $82.50 resistance, it could continue to move down. Initial support on the downside is near the $78 zone. The first major support is near the $75 level.
A break below the $75 level might send the price toward the $70 support zone. If there is a close below the $70 support, the price could decline toward the $62 support in the near term.
Technical Indicators
Hourly MACD – The MACD for SOL/USD is gaining pace in the bearish zone.
Hourly Hours RSI (Relative Strength Index) – The RSI for SOL/USD is below the 50 level.
Major Support Levels – $78 and $75.
Major Resistance Levels – $82.50 and $85.00.


Ayrıca Şunları da Beğenebilirsiniz

Shiba Inu Price Stuck: Bullish Signal Appears, But SHIB Refuses To Move

ServiceNow (NOW) Stock Slips as Weak U.S. Federal Spending Weighs on Outlook


