Bitcoin is experiencing a steep fall as fear rises in the crypto market. Analysts have indicated that the falling market price of Bitcoin indicates that the cryptocurrency is in a definite bear market. Interestingly, not everyone is expecting this to happen. At the time of writing, BTC is trading at $100,605, with a 5.85% decline […]Bitcoin is experiencing a steep fall as fear rises in the crypto market. Analysts have indicated that the falling market price of Bitcoin indicates that the cryptocurrency is in a definite bear market. Interestingly, not everyone is expecting this to happen. At the time of writing, BTC is trading at $100,605, with a 5.85% decline […]

Bitcoin Enters Bear Territory With Price Falling Over 20% From ATH

2025/11/05 09:30
Bitcoin
  • Bitcoin has fallen over 20% from its all-time high, officially entering bearish market conditions.
  • Extreme Fear dominates investors as the Fear and Greed index records a concerning twenty-one level.
  • Heavy liquidations, large ETF outflows, and idle stablecoins reveal hesitation and uncertainty among investors.

Bitcoin is experiencing a steep fall as fear rises in the crypto market. Analysts have indicated that the falling market price of Bitcoin indicates that the cryptocurrency is in a definite bear market. Interestingly, not everyone is expecting this to happen.

At the time of writing, BTC is trading at $100,605, with a 5.85% decline recorded over the last 24 hours. Even with the drop, activity remains high, supported by $117.84 billion in daily volume and a market capitalization of $2.02 trillion.

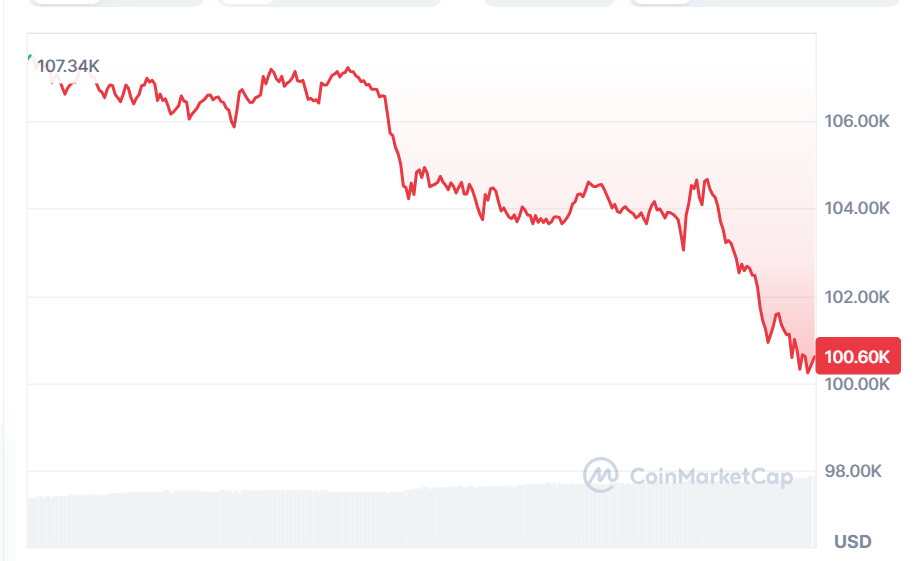
Source: CoinMarketCap

Extreme Decline Pushes Bitcoin into Bear

This price drop means that Bitcoin is now more than 20% below its record high, recorded on October 6, marking an entry into a bear market as classified by traditional analysts. Popular crypto analyst Kobeissi Letter highlighted this change and how Bitcoin’s sentiment has quickly shifted just weeks ago.
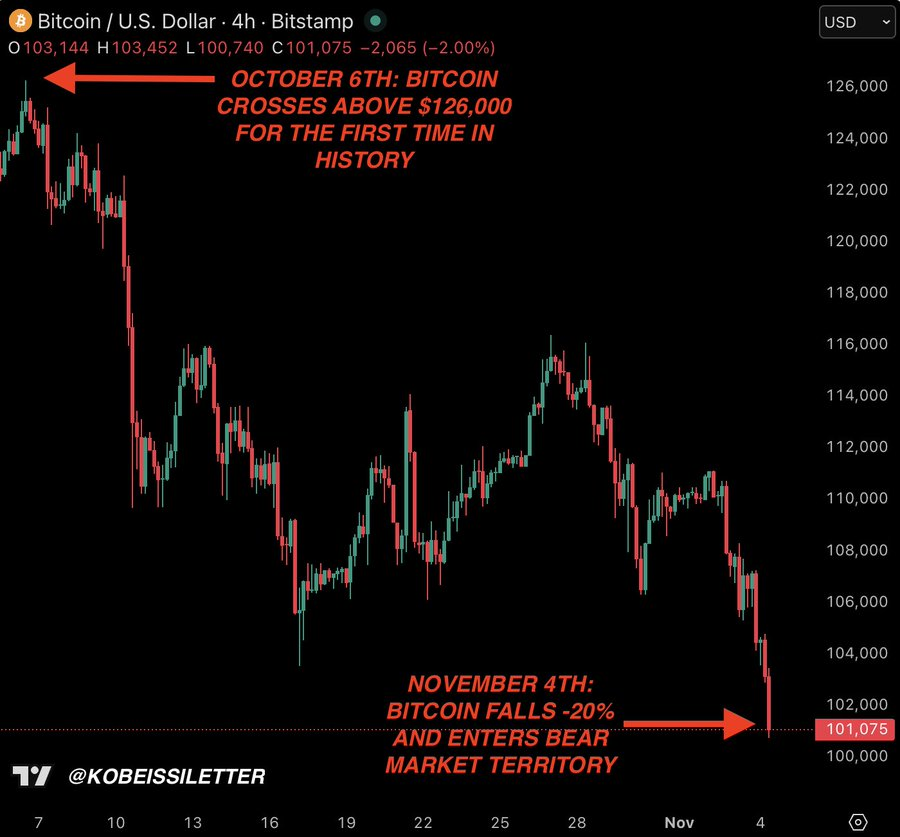
Source: X

While there is a price drop, analyst Kobeissi Letter encouraged their followers to see that this is one part of how crypto markets differ and react differently to every other market.

Also Read | BNB Price Prediction: Can It Hit $1000 By this year’s End?

Bitcoin Drops as Extreme Fear Dominates

Another well-known analyst, Elite Crypto, notes that market anxiety is at record levels. The Fear & Greed index is currently at 21, representing Extreme Fear. This is a situation in which many market players flock to the sidelines as quickly as possible.
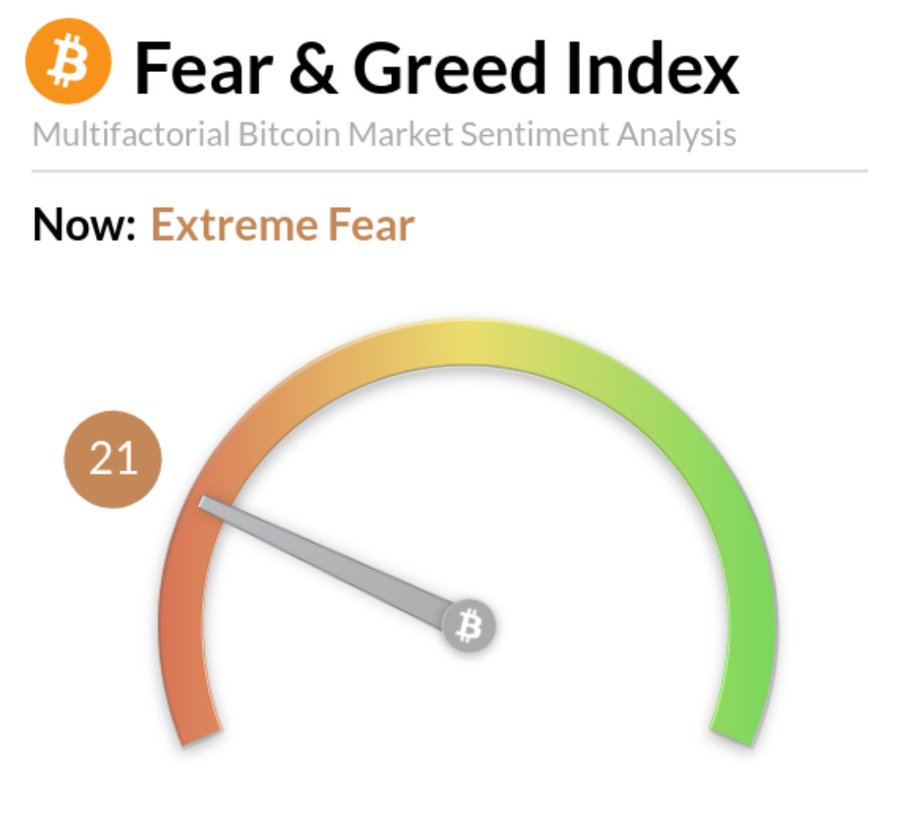
Source: X

It is noted that there is substantial liquidation and ETF outflows, indicative of market hesitation. An increasing amount of stablecoins is also idle and awaiting market guidance.”

“Everyone is scared to buy right now,” wrote Elite Crypto.
“And history shows it just may be when the brightest money minds move in.”

This attitude resonates with what’s been observed in past market cycles as well – when market confidence evaporates and headlines begin to carry a less-than-rosy tone, those who believe in the market have begun to accumulate.

While Bitcoin is hovering just above a psychological level, what happens next could establish the tone for the balance of the year. The coming days will determine whether the buying strength is regained or if the selling is to continue. For now, one thing is certain: fear is rampant, but opportunity is just around the corner.

Also Read | Can Litecoin’s $82 Support Overcome Bearish Pressure?

Disclaimer: The articles reposted on this site are sourced from public platforms and are provided for informational purposes only. They do not necessarily reflect the views of MEXC. All rights remain with the original authors. If you believe any content infringes on third-party rights, please contact service@support.mexc.com for removal. MEXC makes no guarantees regarding the accuracy, completeness, or timeliness of the content and is not responsible for any actions taken based on the information provided. The content does not constitute financial, legal, or other professional advice, nor should it be considered a recommendation or endorsement by MEXC.
Share Insights

You May Also Like

Next XRP ‘Monster Leg’ Will Start No Earlier Than 2026: Analyst

Next XRP ‘Monster Leg’ Will Start No Earlier Than 2026: Analyst

An XRP/BTC long-term chart shared by pseudonymous market technician Dr Cat (@DoctorCatX) points to a delayed—but potentially explosive—upswing for XRP versus Bitcoin, with the analyst arguing that “the next monster leg up” cannot begin before early 2026 if key Ichimoku conditions are to be satisfied on the highest time frames. Posting a two-month (2M) XRP/BTC chart with Ichimoku overlays and date markers for September/October, November/December and January/February, Dr Cat framed the setup around the position of the Chikou Span (CS) relative to price candles and the Tenkan-sen. “Based on the 2M chart I expect the next monster leg up to start no earlier than 2026,” he wrote. “Because the logical time for CS to get free above the candles is Jan/Feb 2026 on an open basis and March 2026 on a close basis, respectively.” XRP/BTC Breakout Window Opens Only In 2026 In Ichimoku methodology, the CS—price shifted back 26 periods—clearing above historical candles and the Tenkan-sen (conversion line) is used to confirm the transition from equilibrium to trending conditions. That threshold, in Dr Cat’s view, hinges on XRP/BTC defending roughly 2,442 sats (0.00002442 BTC). “As you see, the price needs to hold 2442 so that CS is both above the candles and Tenkan Sen,” he said. Related Reading: Facts Vs. Hype: Analyst Examines XRP Supply Shock Theory Should that condition be met, the analyst sees the market “logically” targeting the next major resistance band first around ~7,000 sats, with an extended 2026 objective in a 7,000–12,000 sats corridor on the highest time frames. “If that happens, solely looking at the 2M timeframe the logical thing is to attack the next resistance at ~7K,” he wrote, before adding: “Otherwise on highest timeframes everything still looks excellent and points to 7K–12K in 2026, until further notice.” The roadmap is not without nearer-term risks. Dr Cat flagged a developing signal on the weekly Ichimoku cloud: “One more thing to keep an eye on till then: the weekly chart. Which, if doesn’t renew the yearly high by November/December will get a bearish kumo twist. Which still may not be the end of the world but still deserves attention. So one more evaluation is needed at late 2025 I guess.” A bearish kumo twist—when Senkou Span A crosses below Senkou Span B—can foreshadow a medium-term loss of momentum or a period of consolidation before trend resumption. The discussion quickly turned to the real-world impact of the satoshi-denominated targets. When asked what ~7,000 sats might mean in dollar terms, the analyst cautioned that the conversion floats with Bitcoin’s price but offered a rough yardstick for today’s market. “In current BTC prices are roughly $7.8,” he replied. The figure is illustrative rather than predictive: XRP’s USD price at any future XRP/BTC level will depend on BTC’s own USD value at that time. The posted chart—which annotates the likely windows for CS clearance as “Jan/Feb open CS free” and “March close” following interim checkpoints in September/October and November/December—underscores the time-based nature of the call. On multi-month Ichimoku settings, the lagging span has to “work off” past price structure before a clean upside trend confirmation is possible; forcing the move earlier would, in this framework, risk a rejection back into the cloud or beneath the Tenkan-sen. Contextually, XRP/BTC has been basing in a broad range since early 2024 after a multi-year downtrend from the 2021 peak, with intermittent upside probes failing to reclaim the more consequential resistances that sit thousands of sats higher. The 2,442-sats area Dr Cat highlights aligns with the need to keep the lagging span above both contemporaneous price and the conversion line, a condition that tends to reduce whipsaws on very high time frames. Related Reading: Analyst Sounds Major XRP Warning: Last Chance To Get In As Accumulation Balloons Whether the market ultimately delivers the 7,000–12,000 sats advance in 2026 will, by this read, depend on two things: XRP/BTC’s ability to hold above the ~2,442-sats pivot as the calendar turns through early 2026, and the weekly chart avoiding or quickly invalidating a bearish kumo twist if new yearly highs are not set before November/December. “If that happens… the logical thing is to attack the next resistance at ~7K,” Dr Cat concludes, while stressing that the weekly cloud still “deserves attention.” As with any Ichimoku-driven thesis, the emphasis is on alignment across time frames and the interaction of price with the system’s five lines—Tenkan-sen, Kijun-sen, Senkou Spans A and B (the “kumo” cloud), and the Chikou Span. Dr Cat’s thread leans on the lagging span mechanics to explain why an earlier “monster leg” is statistically less likely, and why the second half of 2025 will be a critical checkpoint before any 2026 trend attempt. For now, the takeaway is a timeline rather than an imminent trigger: the analyst’s base case defers any outsized XRP outperformance versus Bitcoin until after the CS clears historical overhead in early 2026, with interim monitoring of the weekly cloud into year-end. As he summed up, “On highest timeframes everything still looks excellent… until further notice.” At press time, XRP traded at $3.119. Featured image created with DALL.E, chart from TradingView.com
Share
NewsBTC2025/09/19 03:00