An XRP/BTC long-term chart shared by pseudonymous market technician Dr Cat (@DoctorCatX) points to a delayed—but potentially explosive—upswing for XRP versus Bitcoin, with the analyst arguing that “the next monster leg up” cannot begin before early 2026 if key Ichimoku conditions are to be satisfied on the highest time frames. Posting a two-month (2M) XRP/BTC chart with Ichimoku overlays and date markers for September/October, November/December and January/February, Dr Cat framed the setup around the position of the Chikou Span (CS) relative to price candles and the Tenkan-sen. “Based on the 2M chart I expect the next monster leg up to start no earlier than 2026,” he wrote. “Because the logical time for CS to get free above the candles is Jan/Feb 2026 on an open basis and March 2026 on a close basis, respectively.” XRP/BTC Breakout Window Opens Only In 2026 In Ichimoku methodology, the CS—price shifted back 26 periods—clearing above historical candles and the Tenkan-sen (conversion line) is used to confirm the transition from equilibrium to trending conditions. That threshold, in Dr Cat’s view, hinges on XRP/BTC defending roughly 2,442 sats (0.00002442 BTC). “As you see, the price needs to hold 2442 so that CS is both above the candles and Tenkan Sen,” he said. Related Reading: Facts Vs. Hype: Analyst Examines XRP Supply Shock Theory Should that condition be met, the analyst sees the market “logically” targeting the next major resistance band first around ~7,000 sats, with an extended 2026 objective in a 7,000–12,000 sats corridor on the highest time frames. “If that happens, solely looking at the 2M timeframe the logical thing is to attack the next resistance at ~7K,” he wrote, before adding: “Otherwise on highest timeframes everything still looks excellent and points to 7K–12K in 2026, until further notice.” The roadmap is not without nearer-term risks. Dr Cat flagged a developing signal on the weekly Ichimoku cloud: “One more thing to keep an eye on till then: the weekly chart. Which, if doesn’t renew the yearly high by November/December will get a bearish kumo twist. Which still may not be the end of the world but still deserves attention. So one more evaluation is needed at late 2025 I guess.” A bearish kumo twist—when Senkou Span A crosses below Senkou Span B—can foreshadow a medium-term loss of momentum or a period of consolidation before trend resumption. The discussion quickly turned to the real-world impact of the satoshi-denominated targets. When asked what ~7,000 sats might mean in dollar terms, the analyst cautioned that the conversion floats with Bitcoin’s price but offered a rough yardstick for today’s market. “In current BTC prices are roughly $7.8,” he replied. The figure is illustrative rather than predictive: XRP’s USD price at any future XRP/BTC level will depend on BTC’s own USD value at that time. The posted chart—which annotates the likely windows for CS clearance as “Jan/Feb open CS free” and “March close” following interim checkpoints in September/October and November/December—underscores the time-based nature of the call. On multi-month Ichimoku settings, the lagging span has to “work off” past price structure before a clean upside trend confirmation is possible; forcing the move earlier would, in this framework, risk a rejection back into the cloud or beneath the Tenkan-sen. Contextually, XRP/BTC has been basing in a broad range since early 2024 after a multi-year downtrend from the 2021 peak, with intermittent upside probes failing to reclaim the more consequential resistances that sit thousands of sats higher. The 2,442-sats area Dr Cat highlights aligns with the need to keep the lagging span above both contemporaneous price and the conversion line, a condition that tends to reduce whipsaws on very high time frames. Related Reading: Analyst Sounds Major XRP Warning: Last Chance To Get In As Accumulation Balloons Whether the market ultimately delivers the 7,000–12,000 sats advance in 2026 will, by this read, depend on two things: XRP/BTC’s ability to hold above the ~2,442-sats pivot as the calendar turns through early 2026, and the weekly chart avoiding or quickly invalidating a bearish kumo twist if new yearly highs are not set before November/December. “If that happens… the logical thing is to attack the next resistance at ~7K,” Dr Cat concludes, while stressing that the weekly cloud still “deserves attention.” As with any Ichimoku-driven thesis, the emphasis is on alignment across time frames and the interaction of price with the system’s five lines—Tenkan-sen, Kijun-sen, Senkou Spans A and B (the “kumo” cloud), and the Chikou Span. Dr Cat’s thread leans on the lagging span mechanics to explain why an earlier “monster leg” is statistically less likely, and why the second half of 2025 will be a critical checkpoint before any 2026 trend attempt. For now, the takeaway is a timeline rather than an imminent trigger: the analyst’s base case defers any outsized XRP outperformance versus Bitcoin until after the CS clears historical overhead in early 2026, with interim monitoring of the weekly cloud into year-end. As he summed up, “On highest timeframes everything still looks excellent… until further notice.” At press time, XRP traded at $3.119. Featured image created with DALL.E, chart from TradingView.comAn XRP/BTC long-term chart shared by pseudonymous market technician Dr Cat (@DoctorCatX) points to a delayed—but potentially explosive—upswing for XRP versus Bitcoin, with the analyst arguing that “the next monster leg up” cannot begin before early 2026 if key Ichimoku conditions are to be satisfied on the highest time frames. Posting a two-month (2M) XRP/BTC chart with Ichimoku overlays and date markers for September/October, November/December and January/February, Dr Cat framed the setup around the position of the Chikou Span (CS) relative to price candles and the Tenkan-sen. “Based on the 2M chart I expect the next monster leg up to start no earlier than 2026,” he wrote. “Because the logical time for CS to get free above the candles is Jan/Feb 2026 on an open basis and March 2026 on a close basis, respectively.” XRP/BTC Breakout Window Opens Only In 2026 In Ichimoku methodology, the CS—price shifted back 26 periods—clearing above historical candles and the Tenkan-sen (conversion line) is used to confirm the transition from equilibrium to trending conditions. That threshold, in Dr Cat’s view, hinges on XRP/BTC defending roughly 2,442 sats (0.00002442 BTC). “As you see, the price needs to hold 2442 so that CS is both above the candles and Tenkan Sen,” he said. Related Reading: Facts Vs. Hype: Analyst Examines XRP Supply Shock Theory Should that condition be met, the analyst sees the market “logically” targeting the next major resistance band first around ~7,000 sats, with an extended 2026 objective in a 7,000–12,000 sats corridor on the highest time frames. “If that happens, solely looking at the 2M timeframe the logical thing is to attack the next resistance at ~7K,” he wrote, before adding: “Otherwise on highest timeframes everything still looks excellent and points to 7K–12K in 2026, until further notice.” The roadmap is not without nearer-term risks. Dr Cat flagged a developing signal on the weekly Ichimoku cloud: “One more thing to keep an eye on till then: the weekly chart. Which, if doesn’t renew the yearly high by November/December will get a bearish kumo twist. Which still may not be the end of the world but still deserves attention. So one more evaluation is needed at late 2025 I guess.” A bearish kumo twist—when Senkou Span A crosses below Senkou Span B—can foreshadow a medium-term loss of momentum or a period of consolidation before trend resumption. The discussion quickly turned to the real-world impact of the satoshi-denominated targets. When asked what ~7,000 sats might mean in dollar terms, the analyst cautioned that the conversion floats with Bitcoin’s price but offered a rough yardstick for today’s market. “In current BTC prices are roughly $7.8,” he replied. The figure is illustrative rather than predictive: XRP’s USD price at any future XRP/BTC level will depend on BTC’s own USD value at that time. The posted chart—which annotates the likely windows for CS clearance as “Jan/Feb open CS free” and “March close” following interim checkpoints in September/October and November/December—underscores the time-based nature of the call. On multi-month Ichimoku settings, the lagging span has to “work off” past price structure before a clean upside trend confirmation is possible; forcing the move earlier would, in this framework, risk a rejection back into the cloud or beneath the Tenkan-sen. Contextually, XRP/BTC has been basing in a broad range since early 2024 after a multi-year downtrend from the 2021 peak, with intermittent upside probes failing to reclaim the more consequential resistances that sit thousands of sats higher. The 2,442-sats area Dr Cat highlights aligns with the need to keep the lagging span above both contemporaneous price and the conversion line, a condition that tends to reduce whipsaws on very high time frames. Related Reading: Analyst Sounds Major XRP Warning: Last Chance To Get In As Accumulation Balloons Whether the market ultimately delivers the 7,000–12,000 sats advance in 2026 will, by this read, depend on two things: XRP/BTC’s ability to hold above the ~2,442-sats pivot as the calendar turns through early 2026, and the weekly chart avoiding or quickly invalidating a bearish kumo twist if new yearly highs are not set before November/December. “If that happens… the logical thing is to attack the next resistance at ~7K,” Dr Cat concludes, while stressing that the weekly cloud still “deserves attention.” As with any Ichimoku-driven thesis, the emphasis is on alignment across time frames and the interaction of price with the system’s five lines—Tenkan-sen, Kijun-sen, Senkou Spans A and B (the “kumo” cloud), and the Chikou Span. Dr Cat’s thread leans on the lagging span mechanics to explain why an earlier “monster leg” is statistically less likely, and why the second half of 2025 will be a critical checkpoint before any 2026 trend attempt. For now, the takeaway is a timeline rather than an imminent trigger: the analyst’s base case defers any outsized XRP outperformance versus Bitcoin until after the CS clears historical overhead in early 2026, with interim monitoring of the weekly cloud into year-end. As he summed up, “On highest timeframes everything still looks excellent… until further notice.” At press time, XRP traded at $3.119. Featured image created with DALL.E, chart from TradingView.com

Next XRP ‘Monster Leg’ Will Start No Earlier Than 2026: Analyst

2025/09/19 03:00

An XRP/BTC long-term chart shared by pseudonymous market technician Dr Cat (@DoctorCatX) points to a delayed—but potentially explosive—upswing for XRP versus Bitcoin, with the analyst arguing that “the next monster leg up” cannot begin before early 2026 if key Ichimoku conditions are to be satisfied on the highest time frames.

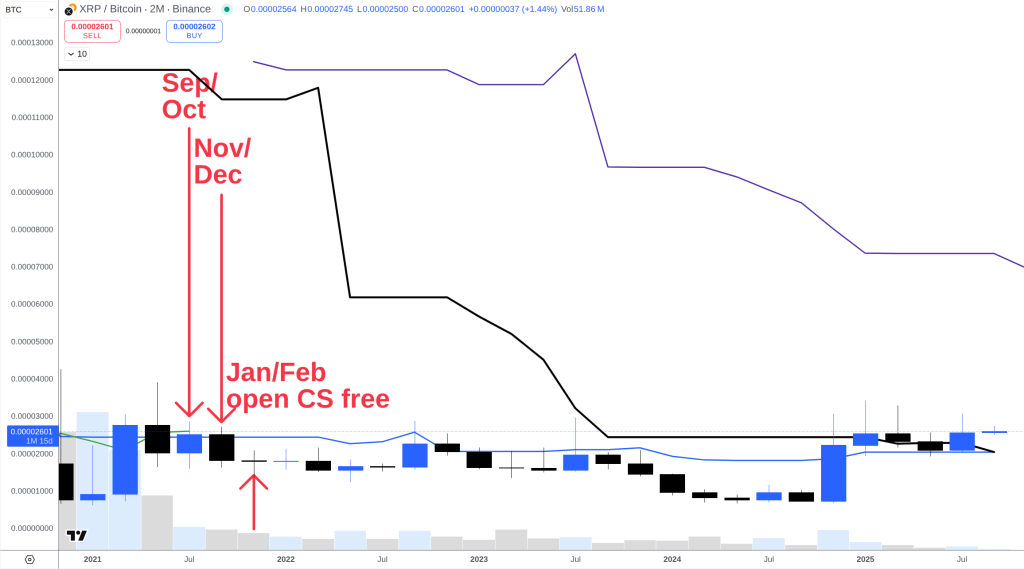
Posting a two-month (2M) XRP/BTC chart with Ichimoku overlays and date markers for September/October, November/December and January/February, Dr Cat framed the setup around the position of the Chikou Span (CS) relative to price candles and the Tenkan-sen. “Based on the 2M chart I expect the next monster leg up to start no earlier than 2026,” he wrote. “Because the logical time for CS to get free above the candles is Jan/Feb 2026 on an open basis and March 2026 on a close basis, respectively.”

XRP/BTC Breakout Window Opens Only In 2026

In Ichimoku methodology, the CS—price shifted back 26 periods—clearing above historical candles and the Tenkan-sen (conversion line) is used to confirm the transition from equilibrium to trending conditions. That threshold, in Dr Cat’s view, hinges on XRP/BTC defending roughly 2,442 sats (0.00002442 BTC). “As you see, the price needs to hold 2442 so that CS is both above the candles and Tenkan Sen,” he said.

Should that condition be met, the analyst sees the market “logically” targeting the next major resistance band first around ~7,000 sats, with an extended 2026 objective in a 7,000–12,000 sats corridor on the highest time frames. “If that happens, solely looking at the 2M timeframe the logical thing is to attack the next resistance at ~7K,” he wrote, before adding: “Otherwise on highest timeframes everything still looks excellent and points to 7K–12K in 2026, until further notice.”
XRP price prediction

The roadmap is not without nearer-term risks. Dr Cat flagged a developing signal on the weekly Ichimoku cloud: “One more thing to keep an eye on till then: the weekly chart. Which, if doesn’t renew the yearly high by November/December will get a bearish kumo twist. Which still may not be the end of the world but still deserves attention. So one more evaluation is needed at late 2025 I guess.” A bearish kumo twist—when Senkou Span A crosses below Senkou Span B—can foreshadow a medium-term loss of momentum or a period of consolidation before trend resumption.

The discussion quickly turned to the real-world impact of the satoshi-denominated targets. When asked what ~7,000 sats might mean in dollar terms, the analyst cautioned that the conversion floats with Bitcoin’s price but offered a rough yardstick for today’s market. “In current BTC prices are roughly $7.8,” he replied. The figure is illustrative rather than predictive: XRP’s USD price at any future XRP/BTC level will depend on BTC’s own USD value at that time.

The posted chart—which annotates the likely windows for CS clearance as “Jan/Feb open CS free” and “March close” following interim checkpoints in September/October and November/December—underscores the time-based nature of the call. On multi-month Ichimoku settings, the lagging span has to “work off” past price structure before a clean upside trend confirmation is possible; forcing the move earlier would, in this framework, risk a rejection back into the cloud or beneath the Tenkan-sen.

Contextually, XRP/BTC has been basing in a broad range since early 2024 after a multi-year downtrend from the 2021 peak, with intermittent upside probes failing to reclaim the more consequential resistances that sit thousands of sats higher. The 2,442-sats area Dr Cat highlights aligns with the need to keep the lagging span above both contemporaneous price and the conversion line, a condition that tends to reduce whipsaws on very high time frames.

Whether the market ultimately delivers the 7,000–12,000 sats advance in 2026 will, by this read, depend on two things: XRP/BTC’s ability to hold above the ~2,442-sats pivot as the calendar turns through early 2026, and the weekly chart avoiding or quickly invalidating a bearish kumo twist if new yearly highs are not set before November/December. “If that happens… the logical thing is to attack the next resistance at ~7K,” Dr Cat concludes, while stressing that the weekly cloud still “deserves attention.”

As with any Ichimoku-driven thesis, the emphasis is on alignment across time frames and the interaction of price with the system’s five lines—Tenkan-sen, Kijun-sen, Senkou Spans A and B (the “kumo” cloud), and the Chikou Span. Dr Cat’s thread leans on the lagging span mechanics to explain why an earlier “monster leg” is statistically less likely, and why the second half of 2025 will be a critical checkpoint before any 2026 trend attempt.

For now, the takeaway is a timeline rather than an imminent trigger: the analyst’s base case defers any outsized XRP outperformance versus Bitcoin until after the CS clears historical overhead in early 2026, with interim monitoring of the weekly cloud into year-end. As he summed up, “On highest timeframes everything still looks excellent… until further notice.”

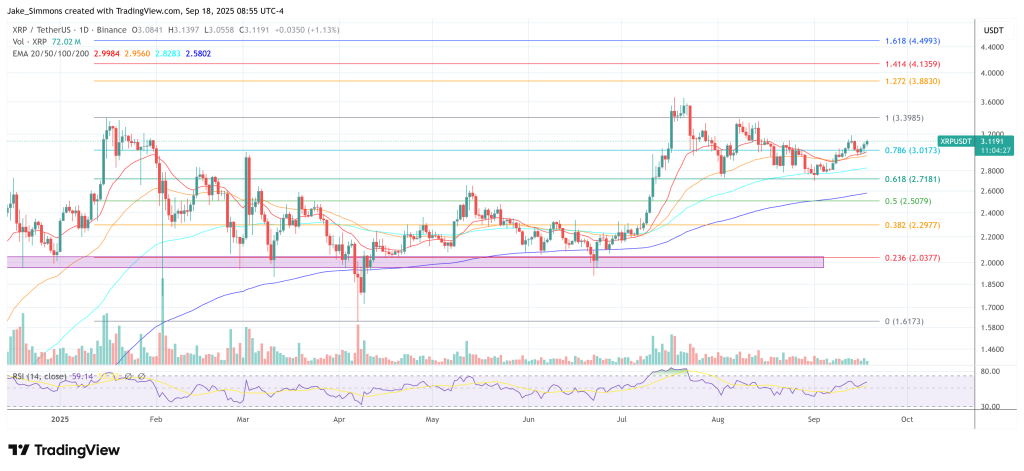
At press time, XRP traded at $3.119.
XRP price
Disclaimer: The articles reposted on this site are sourced from public platforms and are provided for informational purposes only. They do not necessarily reflect the views of MEXC. All rights remain with the original authors. If you believe any content infringes on third-party rights, please contact service@support.mexc.com for removal. MEXC makes no guarantees regarding the accuracy, completeness, or timeliness of the content and is not responsible for any actions taken based on the information provided. The content does not constitute financial, legal, or other professional advice, nor should it be considered a recommendation or endorsement by MEXC.
Share Insights

You May Also Like

Bitcoin $1M by 2030: Coinbase CEO Unveils Astounding Prediction

Bitcoin $1M by 2030: Coinbase CEO Unveils Astounding Prediction

BitcoinWorld Bitcoin $1M by 2030: Coinbase CEO Unveils Astounding Prediction Imagine a future where a single Bitcoin is worth an astonishing $1 million. This bold vision isn’t from a science fiction novel; it’s a serious prediction from none other than Coinbase CEO Brian Armstrong. He recently shared his belief on X that Bitcoin $1M by 2030 is not just possible but probable, given its current progress and the need for a long-term perspective. This exciting forecast has naturally sent ripples through the cryptocurrency community, prompting many to consider the incredible potential trajectory of the world’s leading digital asset. What Fuels the Vision of Bitcoin $1M by 2030? Brian Armstrong’s prediction stems from a deep understanding of Bitcoin’s fundamentals and its historical performance. He emphasizes that looking at Bitcoin through a short-term lens misses the bigger picture. Over its existence, Bitcoin has demonstrated remarkable resilience and growth, consistently breaking through previous price ceilings. This long-term view is crucial when discussing ambitious targets like Bitcoin $1M by 2030. One of the core drivers is Bitcoin’s inherent scarcity. Unlike traditional currencies that can be printed endlessly, Bitcoin has a fixed supply cap of 21 million coins. This hard limit, combined with increasing demand, creates a powerful economic dynamic. As more individuals, institutions, and even nations adopt Bitcoin, its value proposition strengthens, making such a high valuation seem less like a dream and more like a potential reality. Understanding Bitcoin’s Unique Growth Trajectory Bitcoin’s journey is punctuated by unique events known as “halvings.” Approximately every four years, the reward miners receive for validating transactions is cut in half. This mechanism further reduces the supply of new Bitcoin entering the market, historically leading to significant price appreciation. The most recent halving occurred in April 2024, and past cycles suggest that the impact of these events plays a vital role in Bitcoin’s long-term value accumulation. Moreover, increasing global access to digital assets through user-friendly platforms like Coinbase contributes significantly to its expanding user base. The growing interest from institutional investors is another undeniable force. The approval of spot Bitcoin Exchange-Traded Funds (ETFs) in the United States marked a pivotal moment, opening the floodgates for traditional finance to invest in Bitcoin more easily. This institutional capital inflow provides substantial liquidity and legitimacy, further paving the way for a future where Bitcoin $1M by 2030 could be a benchmark. Is Bitcoin $1M by 2030 Realistic? Examining Key Factors While Armstrong’s prediction is optimistic, it’s grounded in observable trends and economic principles. Let’s break down some of the key factors that could contribute to this monumental rise: Increasing Global Adoption: As more countries explore central bank digital currencies (CBDCs) and people seek alternatives to traditional financial systems, Bitcoin’s role as a decentralized, borderless asset becomes more appealing. Inflationary Pressures: Persistent inflation in fiat currencies drives individuals and institutions to store wealth in assets with a limited supply, like Bitcoin, as a hedge. Technological Advancements: Continuous improvements in Bitcoin’s underlying technology, such as the Lightning Network for faster transactions, enhance its utility and scalability, making it more attractive for everyday use. Demographic Shift: Younger generations, who are more digitally native, are increasingly comfortable with cryptocurrencies, suggesting a long-term shift in investment preferences. These combined forces paint a compelling picture for Bitcoin’s future. However, it’s also important to consider potential challenges. Navigating the Roadblocks on the Path to Bitcoin $1M by 2030 Reaching a $1 million valuation for Bitcoin will not be without its hurdles. The cryptocurrency market is known for its volatility, and significant price swings are a common occurrence. Regulatory uncertainty remains a concern in various jurisdictions, which could impact adoption and market sentiment. Furthermore, technological risks, such as potential security vulnerabilities or competition from emerging digital assets, always exist. Investors must approach such predictions with a balanced perspective. While the potential for Bitcoin $1M by 2030 is exciting, it’s crucial to understand the risks involved. Diversification and thorough research are always recommended before making any investment decisions. Armstrong himself emphasizes the need for a long-term view, suggesting that patience will be a key virtue for those hoping to witness this monumental achievement. What Does This Mean for You? Brian Armstrong’s forecast offers a glimpse into a potentially transformative future for finance. It underscores Bitcoin’s growing importance as a global store of value and a significant asset class. For those new to crypto, this prediction highlights the long-term potential of digital assets. For seasoned investors, it reinforces the conviction many already hold about Bitcoin’s enduring value. Ultimately, the journey to Bitcoin $1M by 2030 will likely be dynamic and challenging, but the underlying fundamentals and increasing mainstream acceptance provide a strong foundation for this ambitious goal. It’s a testament to the revolutionary power of decentralized finance and the digital age. To learn more about the latest Bitcoin trends, explore our article on key developments shaping Bitcoin price action. Frequently Asked Questions About Bitcoin’s Future Here are some common questions regarding Brian Armstrong’s bold prediction for Bitcoin: Who made the prediction about Bitcoin reaching $1 million by 2030?Coinbase CEO Brian Armstrong stated his belief on X (formerly Twitter) that Bitcoin could reach $1 million by 2030. What are the main reasons cited for the Bitcoin $1M by 2030 prediction?Key reasons include Bitcoin’s fixed supply (scarcity), increasing global adoption by individuals and institutions, the impact of halving events, and its role as a hedge against inflation. Are there significant risks to Bitcoin reaching this price target?Yes, significant risks include market volatility, potential regulatory challenges, technological vulnerabilities, and competition from other cryptocurrencies. How does Bitcoin’s scarcity contribute to its potential value?With a fixed supply of 21 million coins, Bitcoin’s scarcity means that as demand increases, its value tends to rise, assuming all other factors remain constant. What should investors consider in light of this prediction?Investors should consider a long-term perspective, conduct thorough research, understand the inherent risks of cryptocurrency, and avoid making investment decisions based solely on predictions. Share Your Thoughts on Bitcoin’s Future! If Brian Armstrong’s vision of Bitcoin $1M by 2030 sparks your interest or curiosity, we encourage you to share this article with your friends, family, and social media network! Let’s ignite a wider conversation about the incredible potential of cryptocurrency and what this ambitious forecast could mean for the global financial landscape. Your insights and discussions are invaluable as we collectively explore the future of digital assets! This post Bitcoin $1M by 2030: Coinbase CEO Unveils Astounding Prediction first appeared on BitcoinWorld.
Share
Coinstats2025/09/24 09:25
Share